Dashboard Overview
The LoadFlux dashboard is a React application served at your configured path (default /loadflux). It has six pages accessible from the sidebar.
Dashboard (Home)
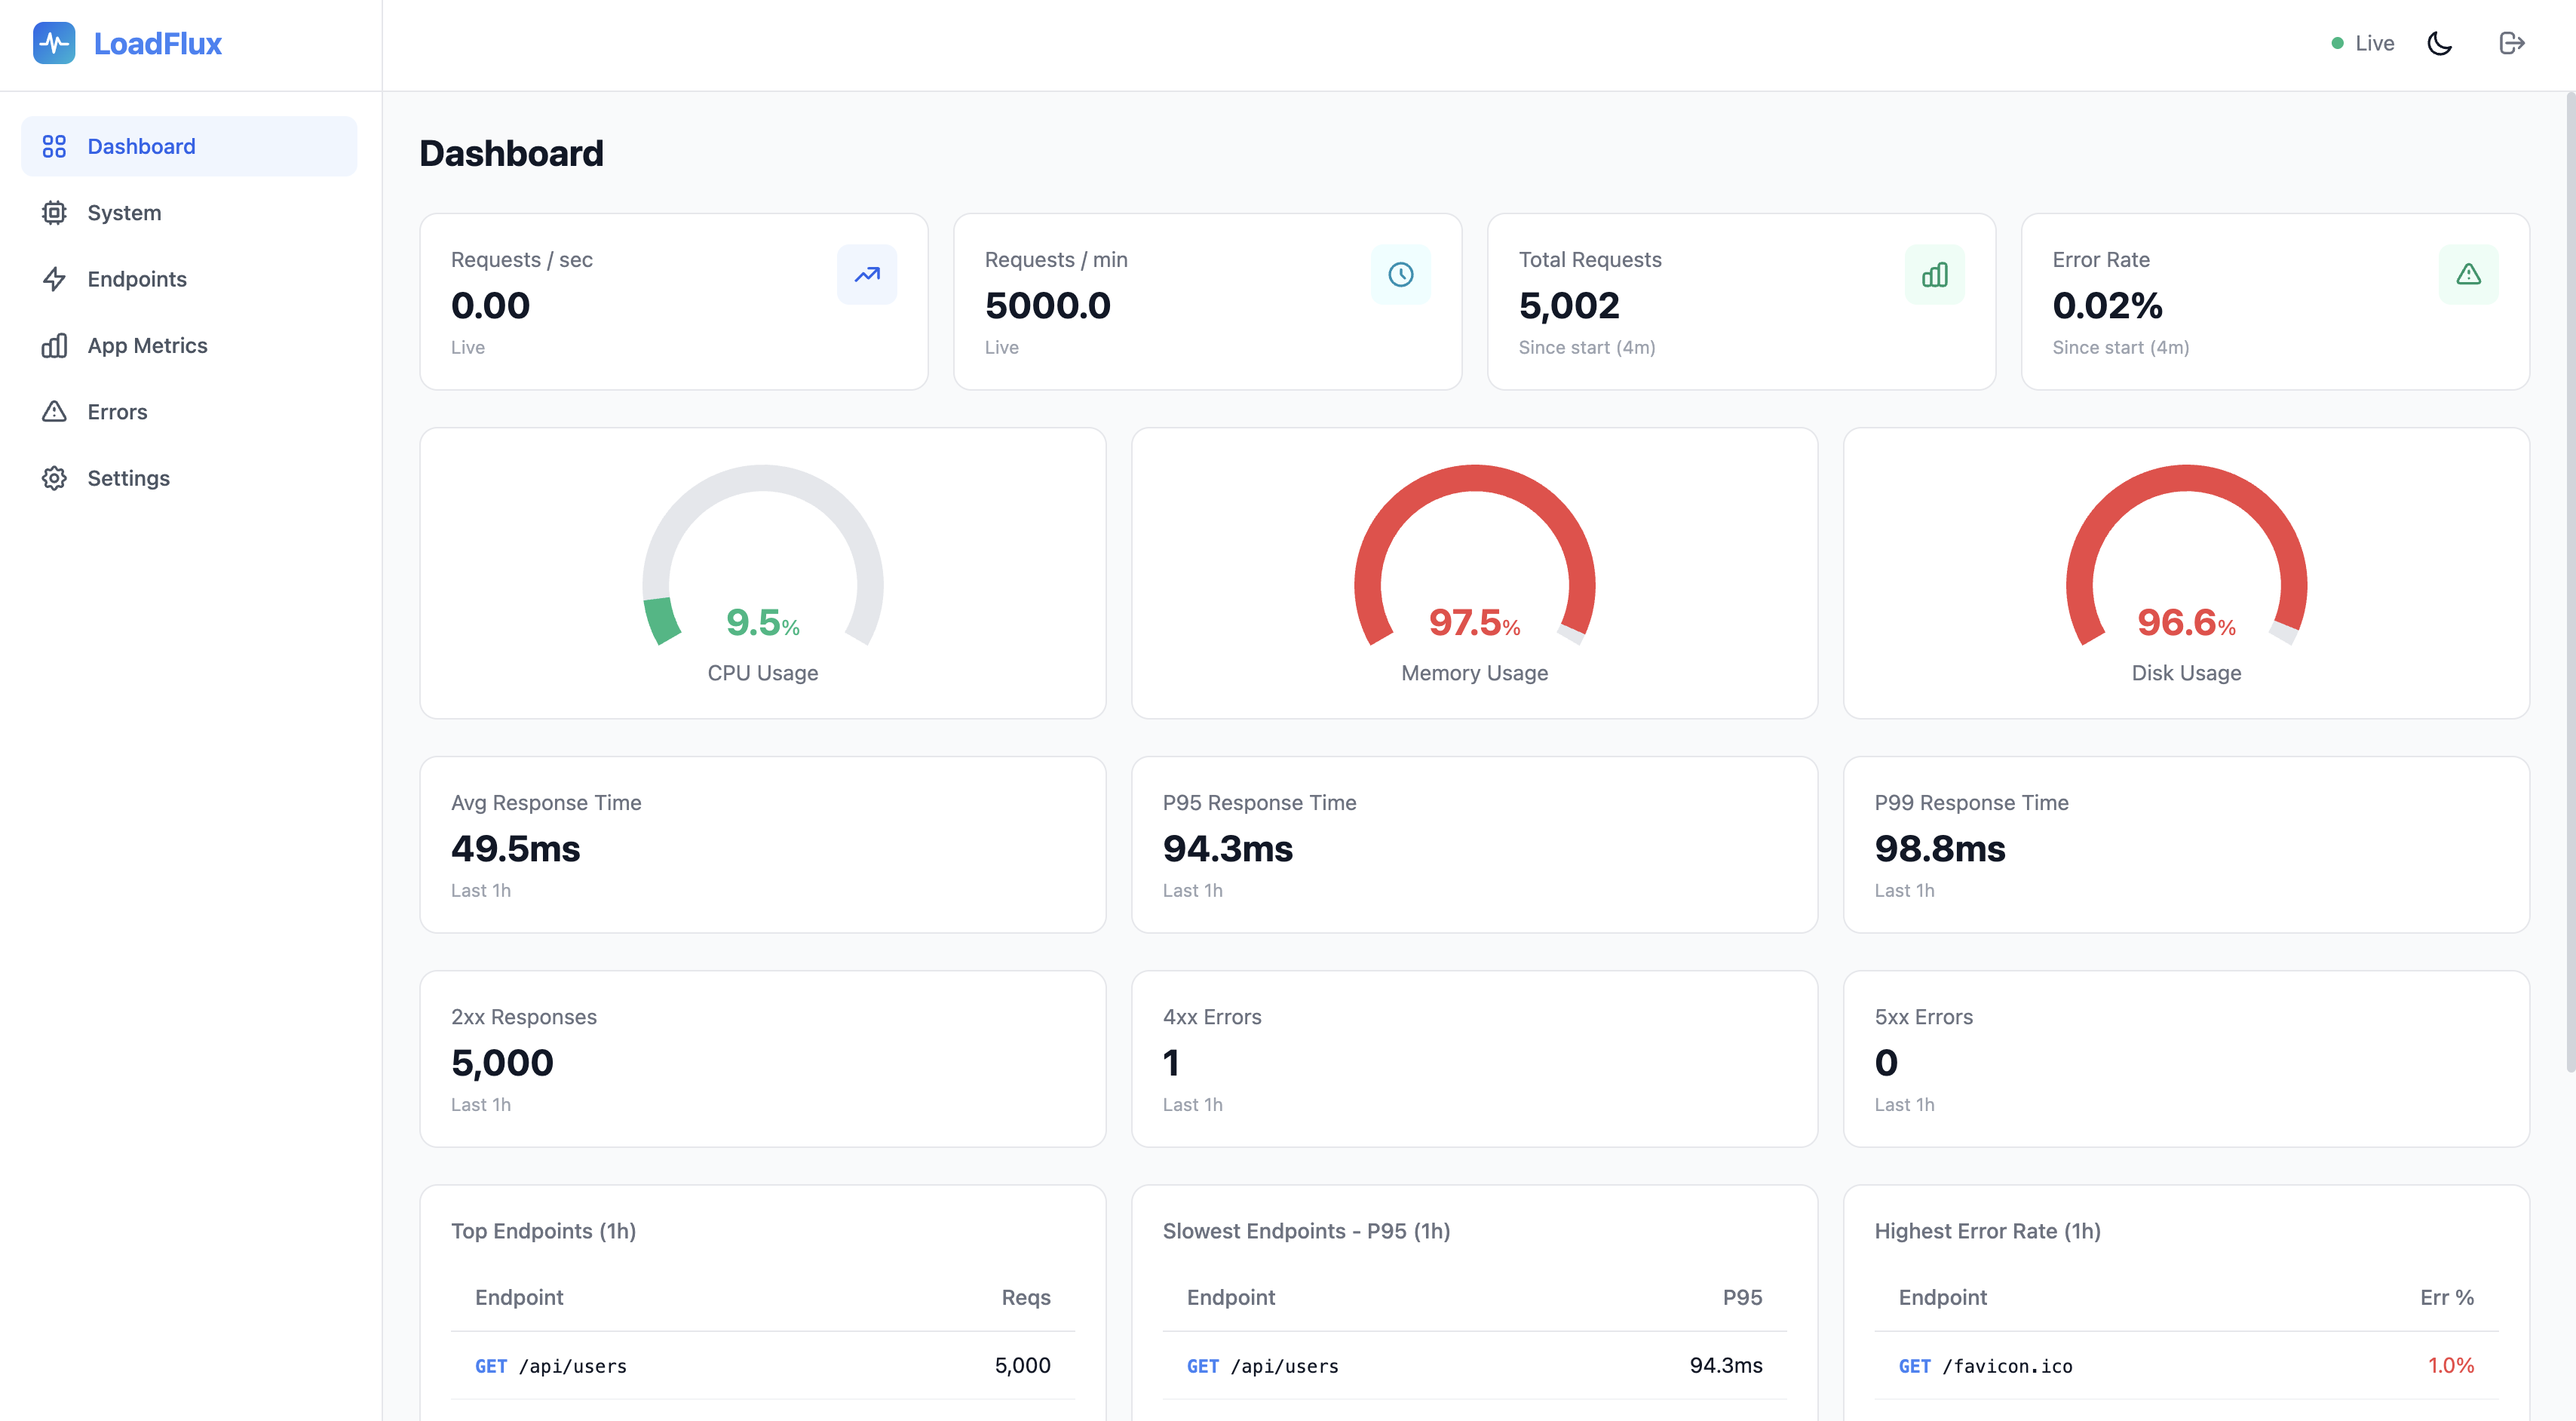
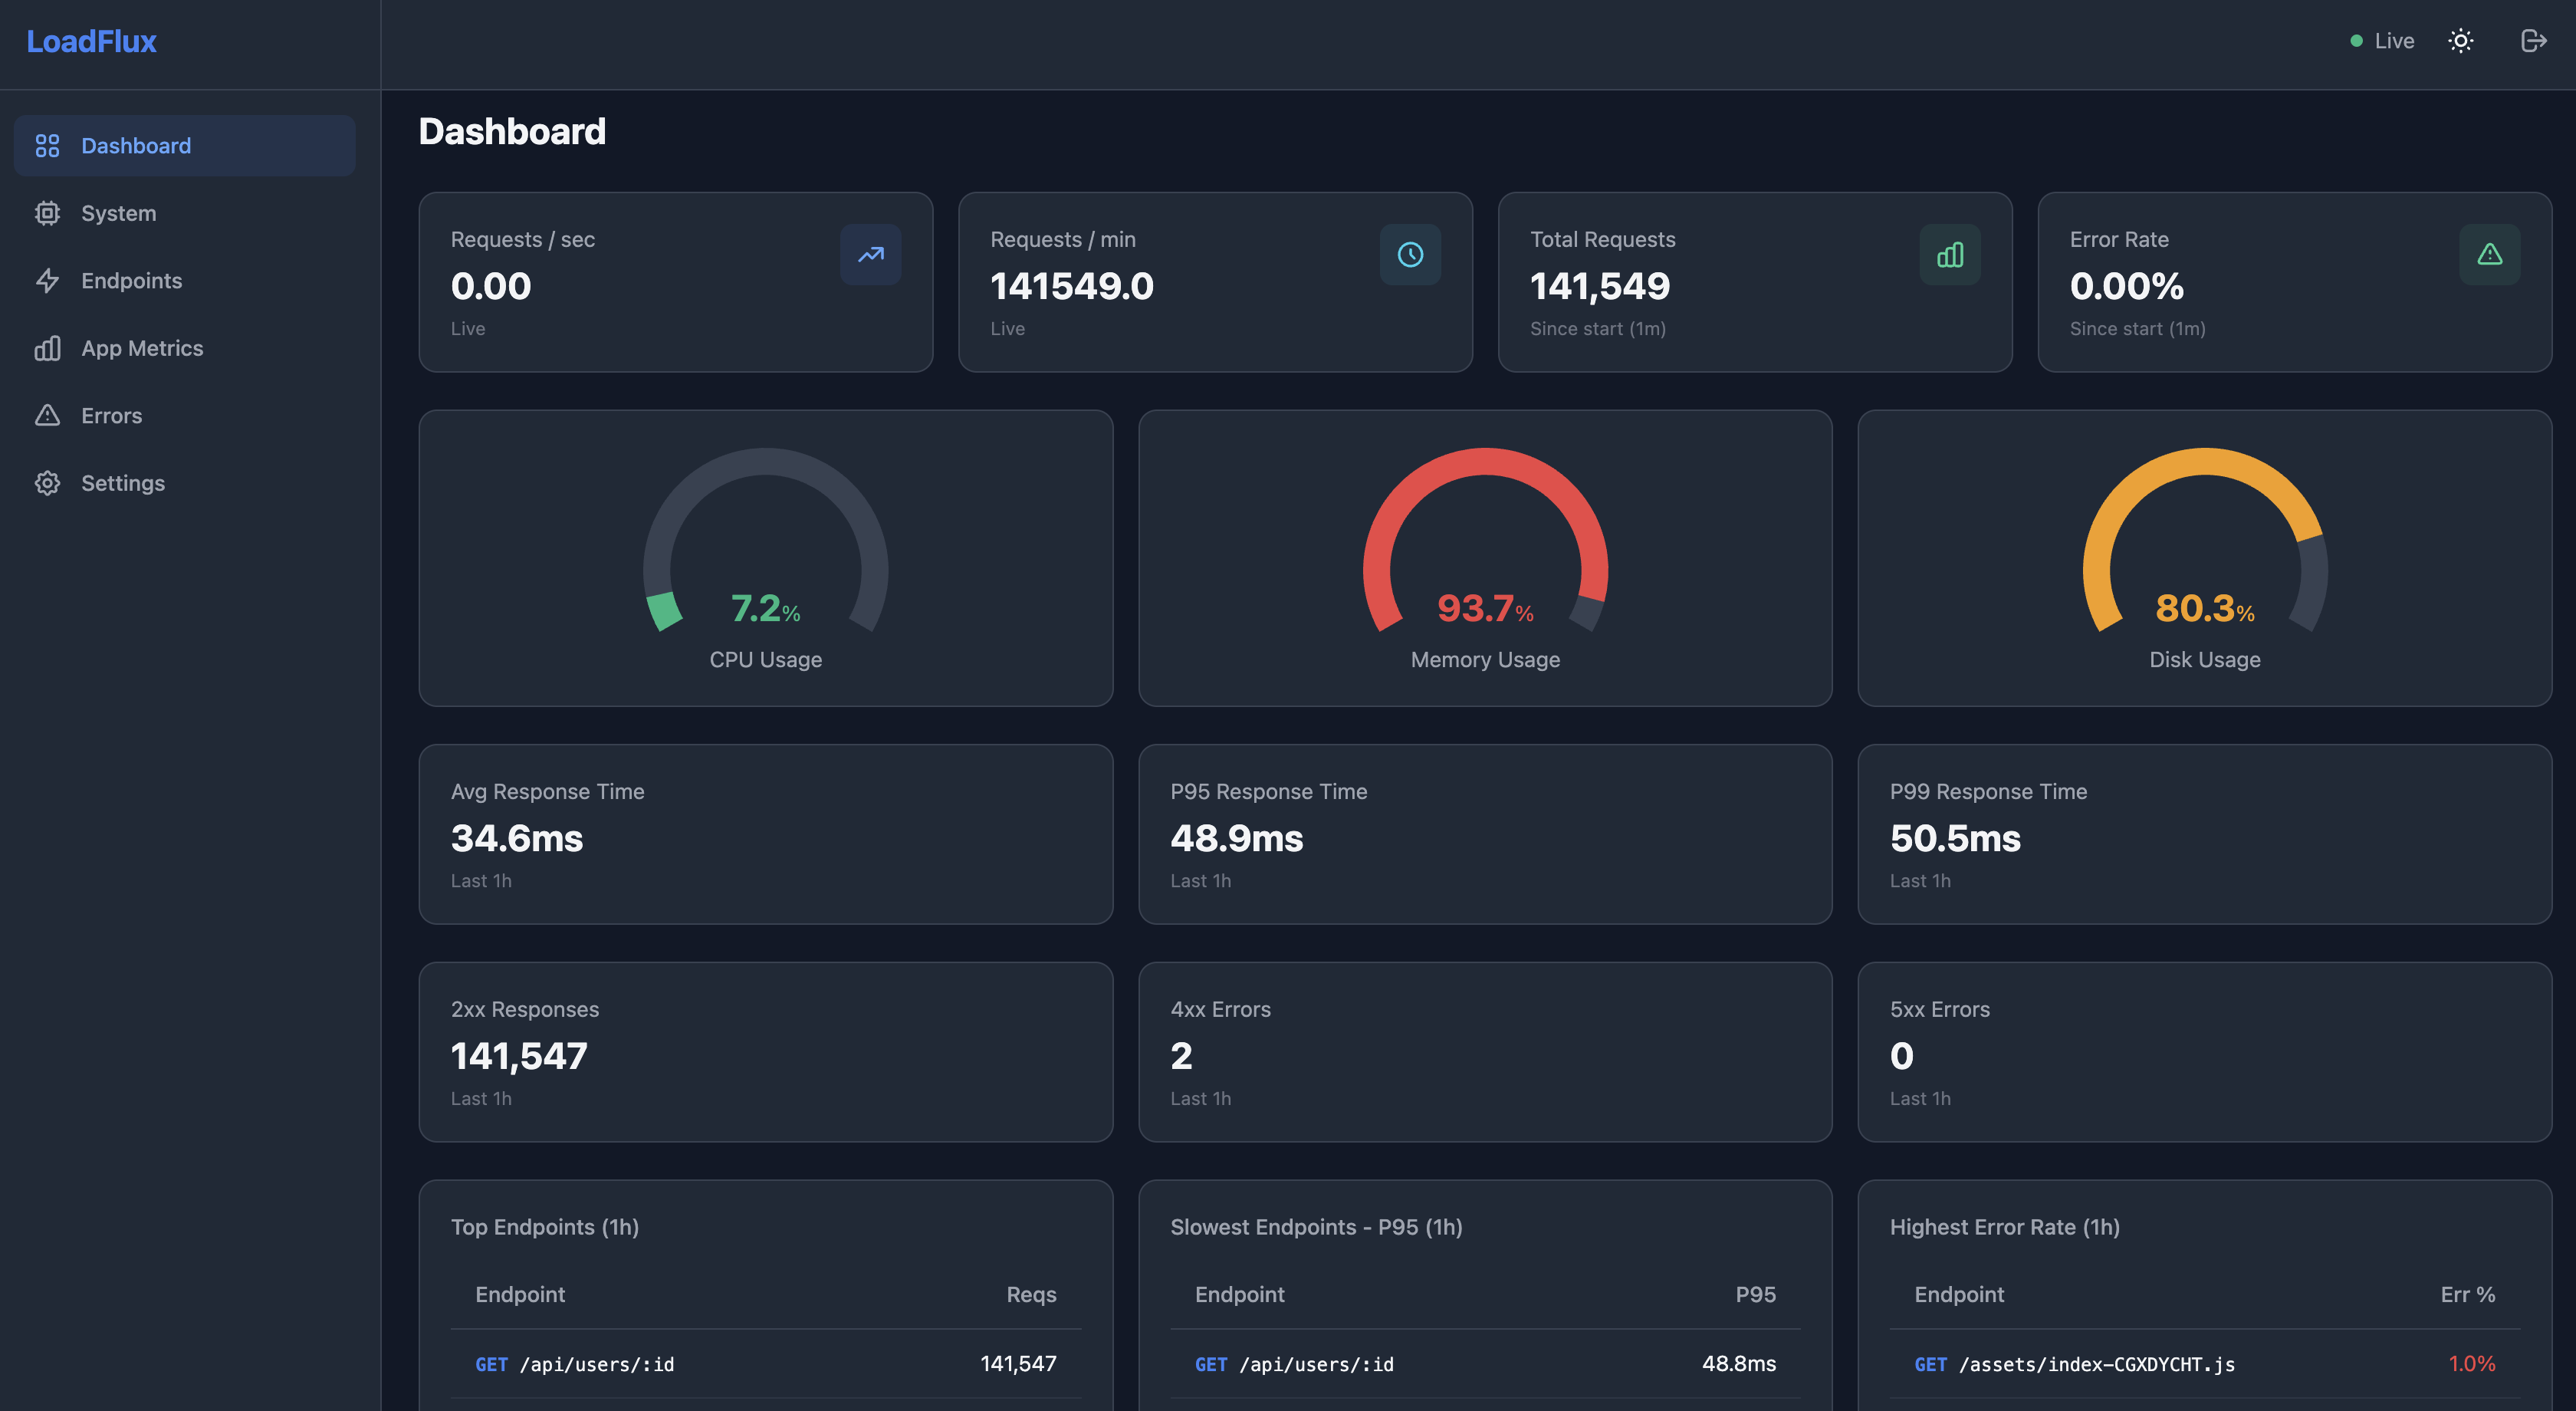
The main page shows a real-time overview:
- Request rate — RPS (requests per second) and RPM (requests per minute)
- Response time — Average, P95, and P99 latency
- Error rate — Percentage of 4xx/5xx responses
- Status breakdown — 2xx, 4xx, and 5xx counts
- Top endpoints — Highest traffic routes (1h window)
- Slowest endpoints — Routes with highest P95 latency (1h window)
- Highest error rate — Routes with the most errors (1h window)
- Server info — Node.js version, platform, PID, active SSE connections
All data on this page updates in real-time via SSE (every 2 seconds).
System
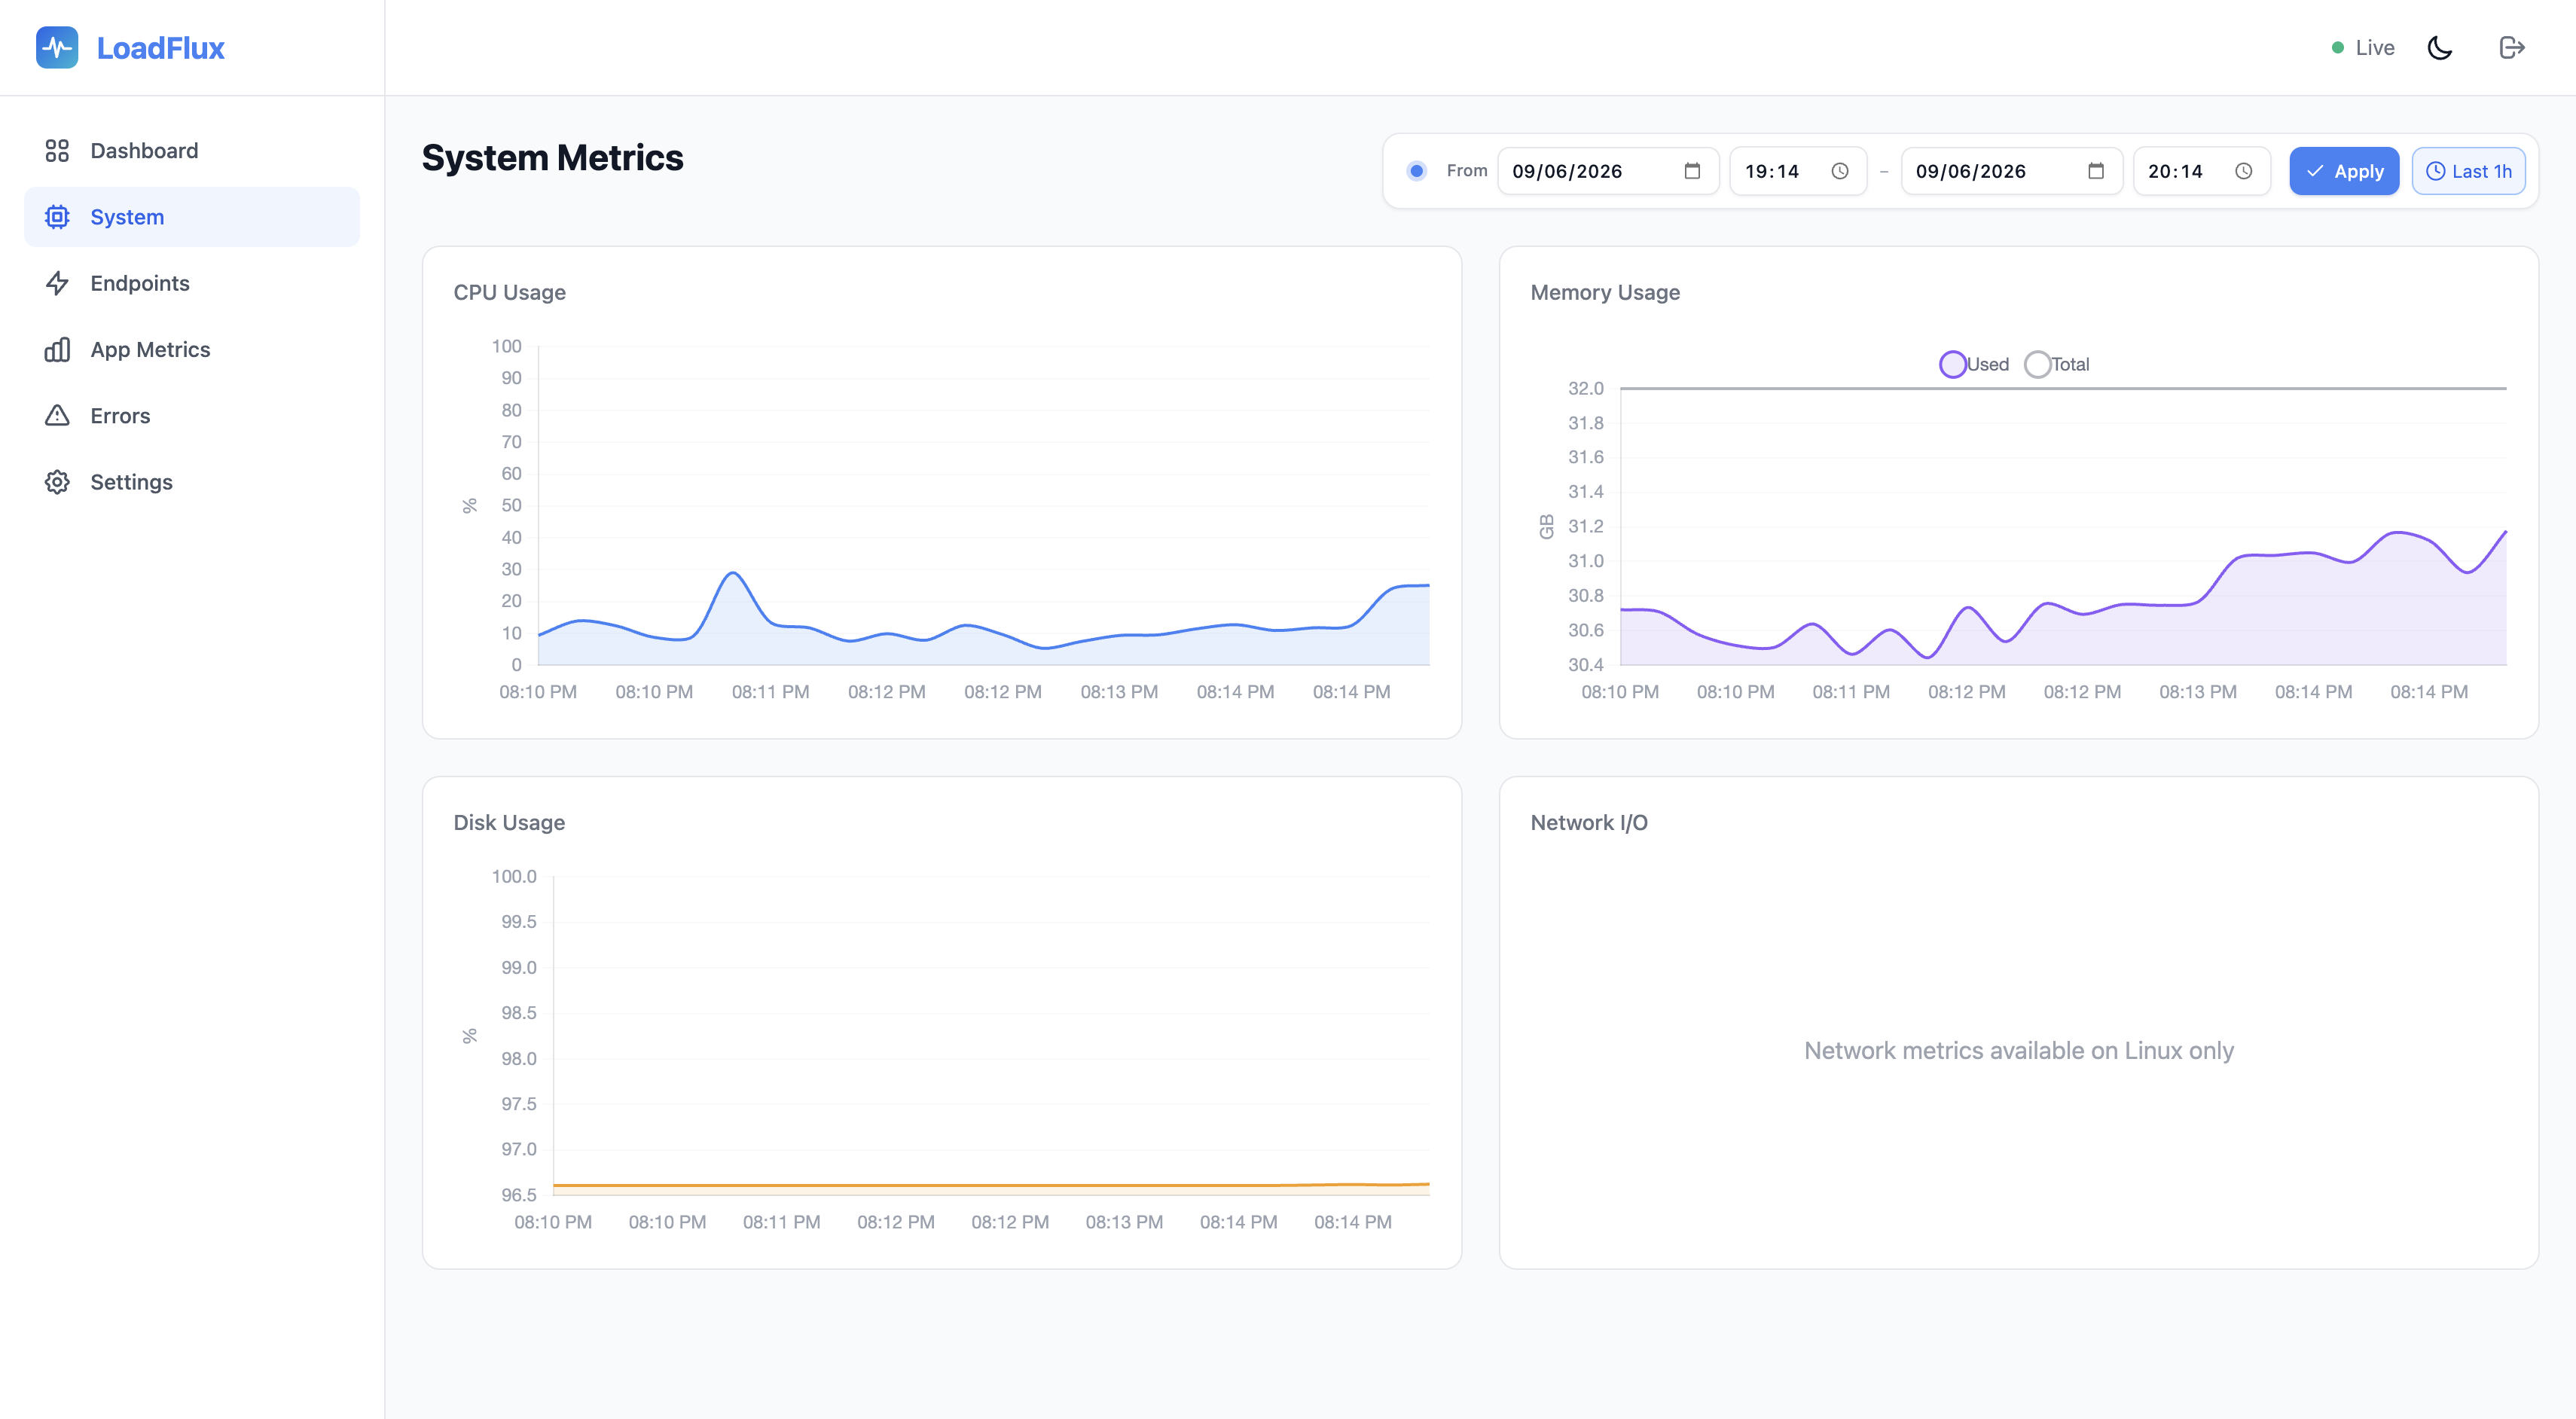
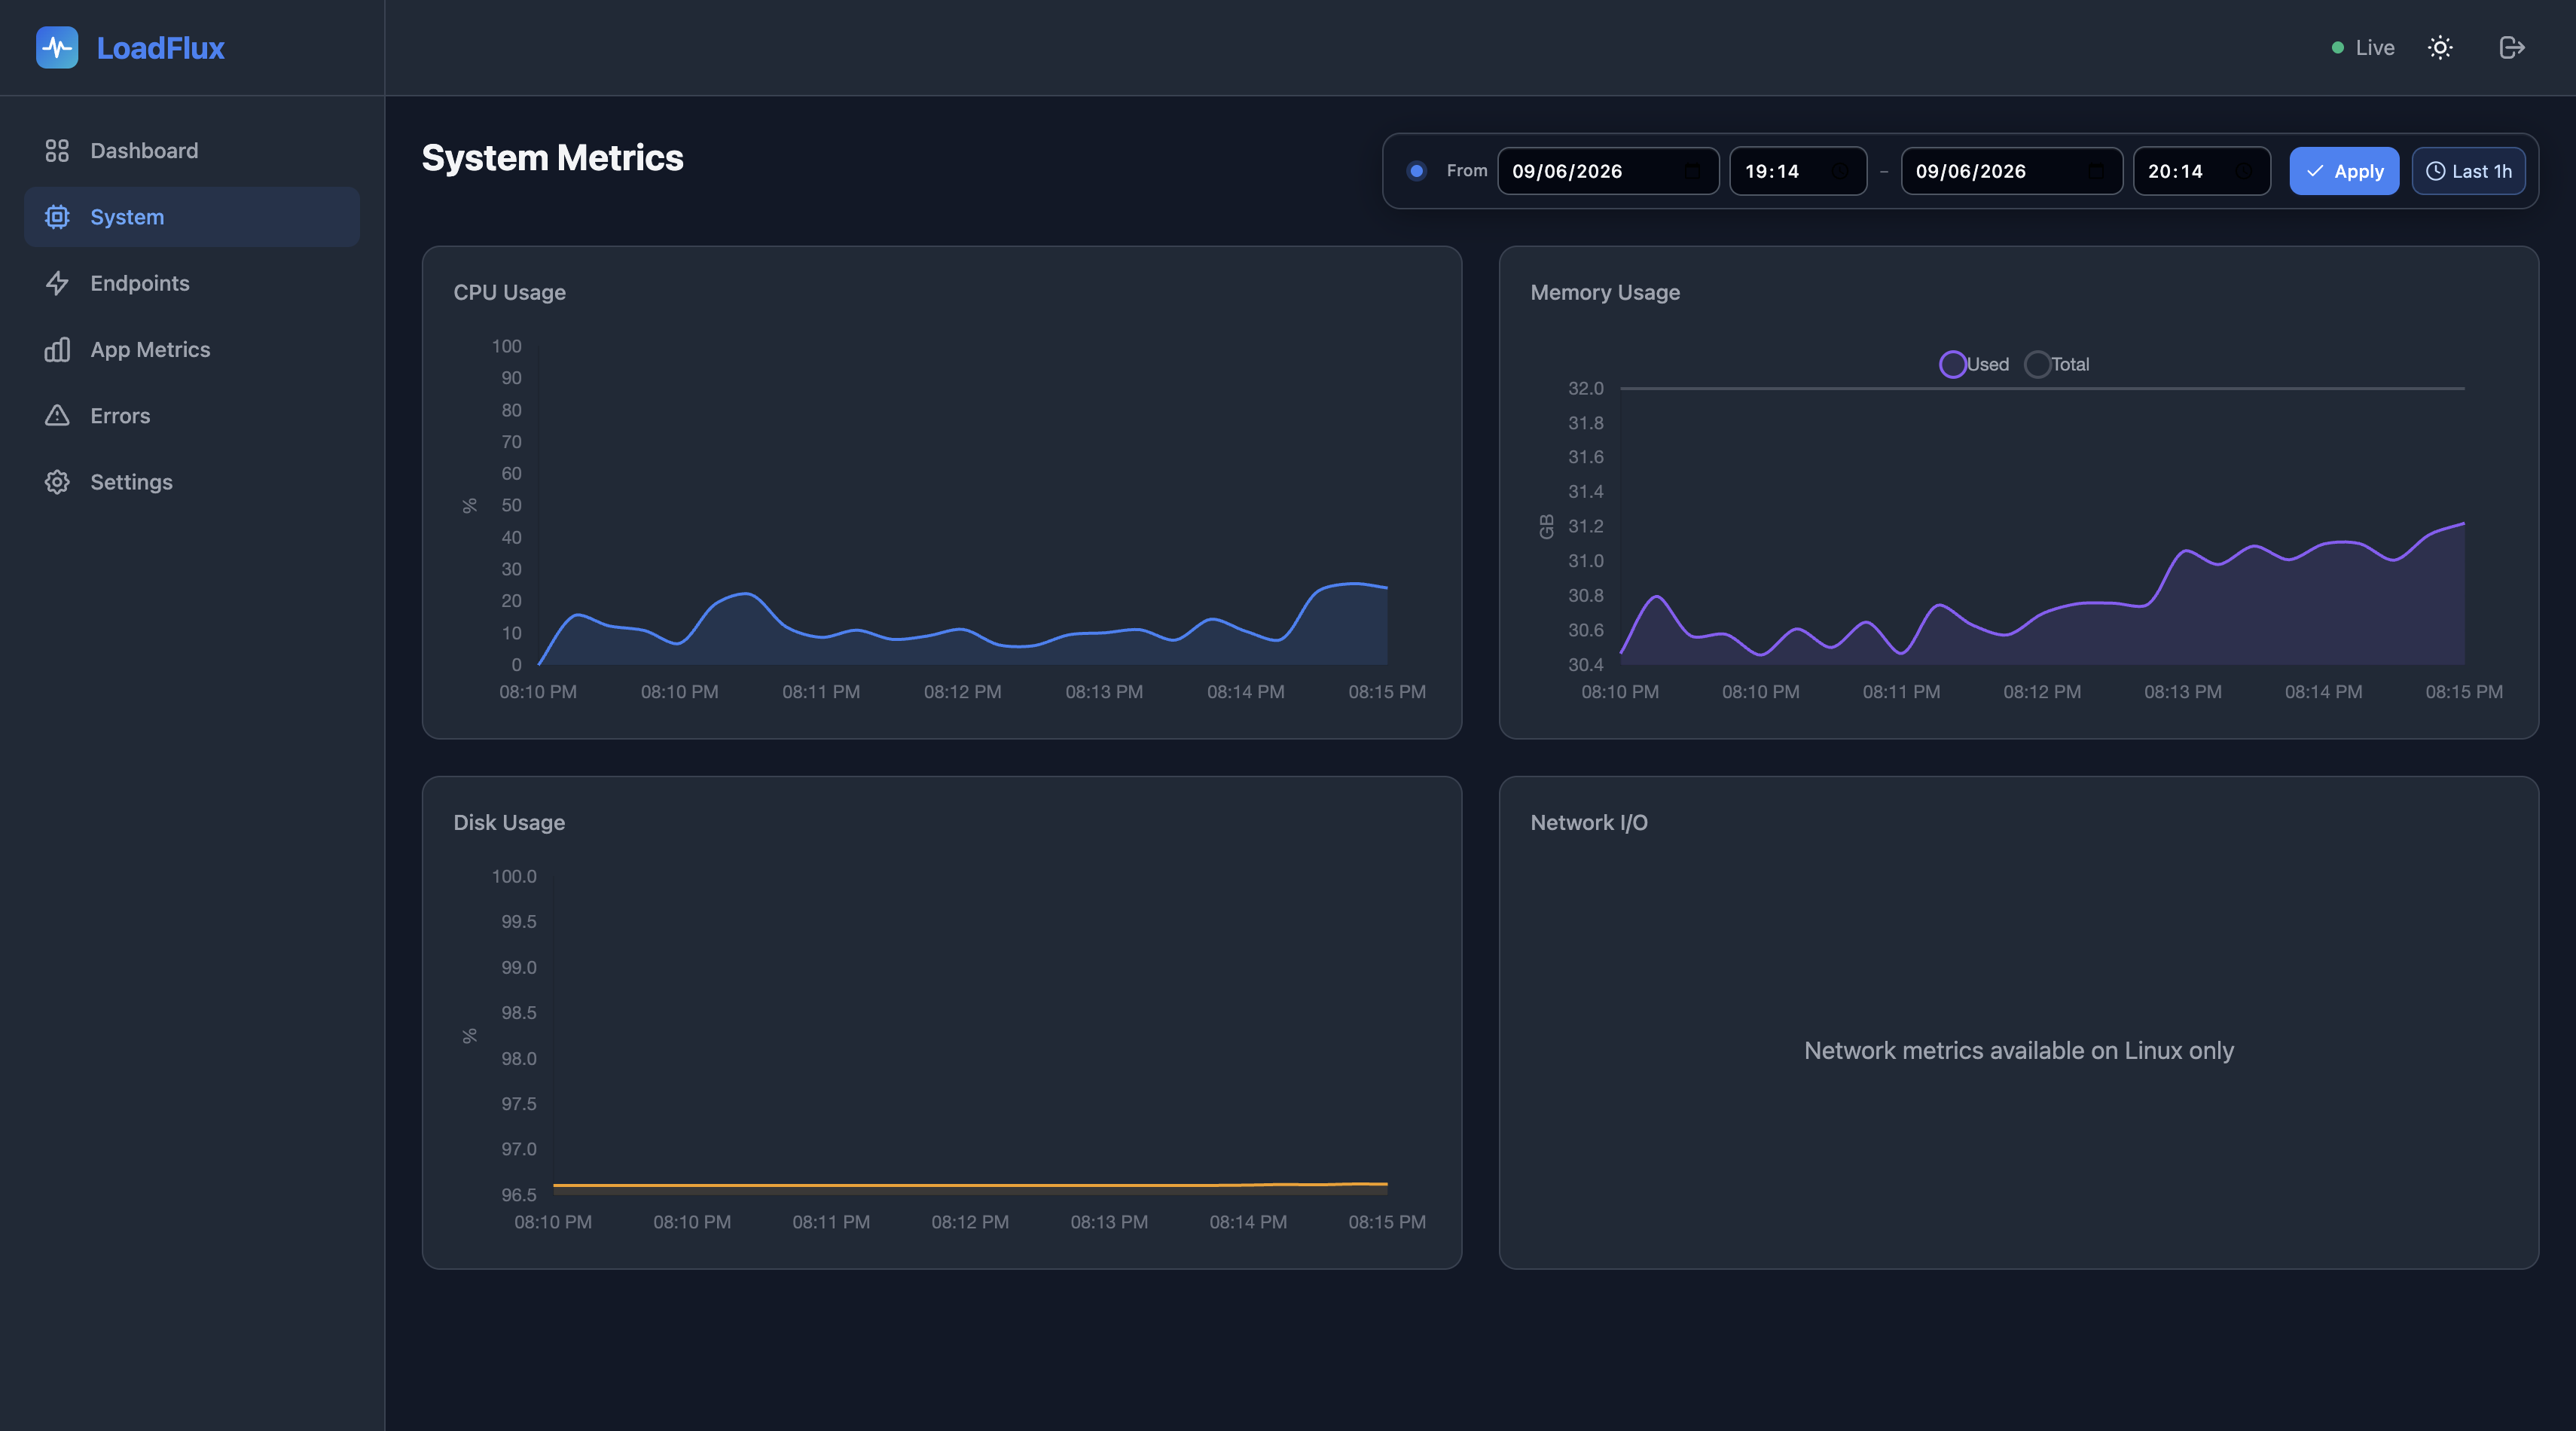
System resource monitoring with time-series charts:
- CPU usage — Percentage over time
- Memory — Used vs total RAM
- Disk — Used vs total space (where available)
- Network I/O — Bytes received/transmitted (Linux only; macOS/Windows show N/A)
Use the time range control (custom from/to date and time, then Apply) to query any window within your retention. Last 1h resets to a rolling one-hour window (the default). Wide ranges are downsampled on the client so charts stay responsive.
Endpoints
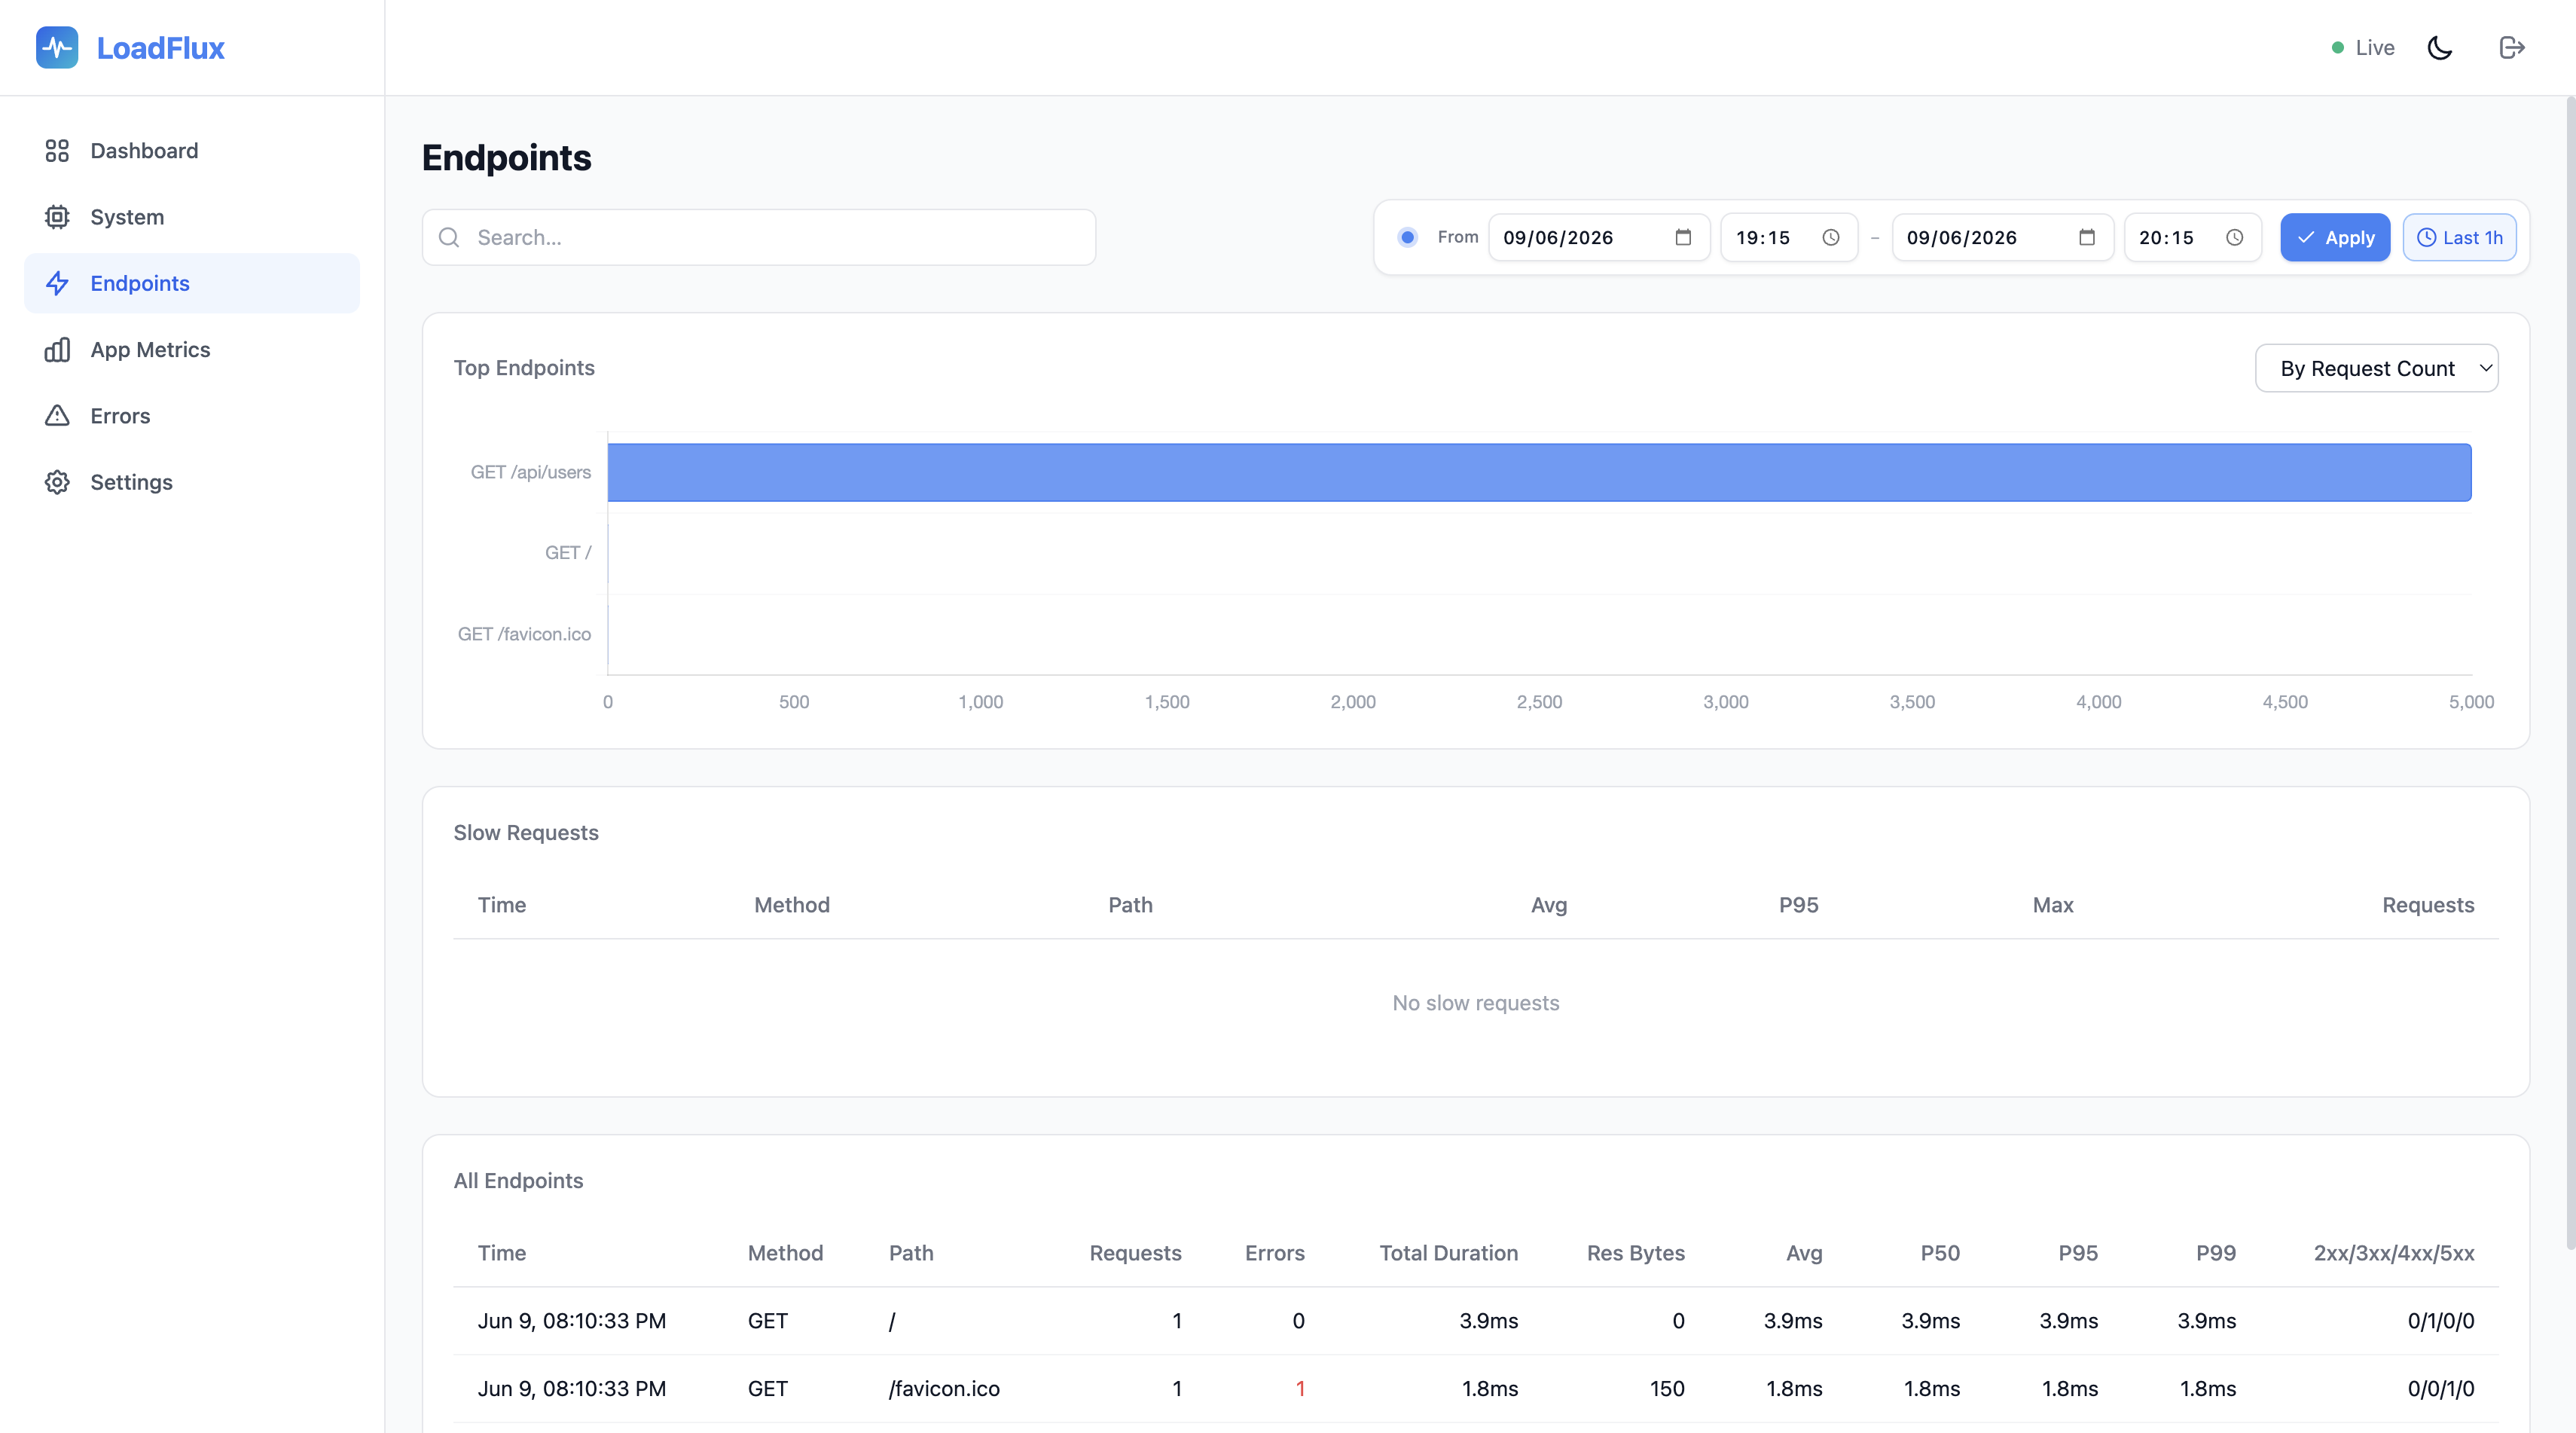
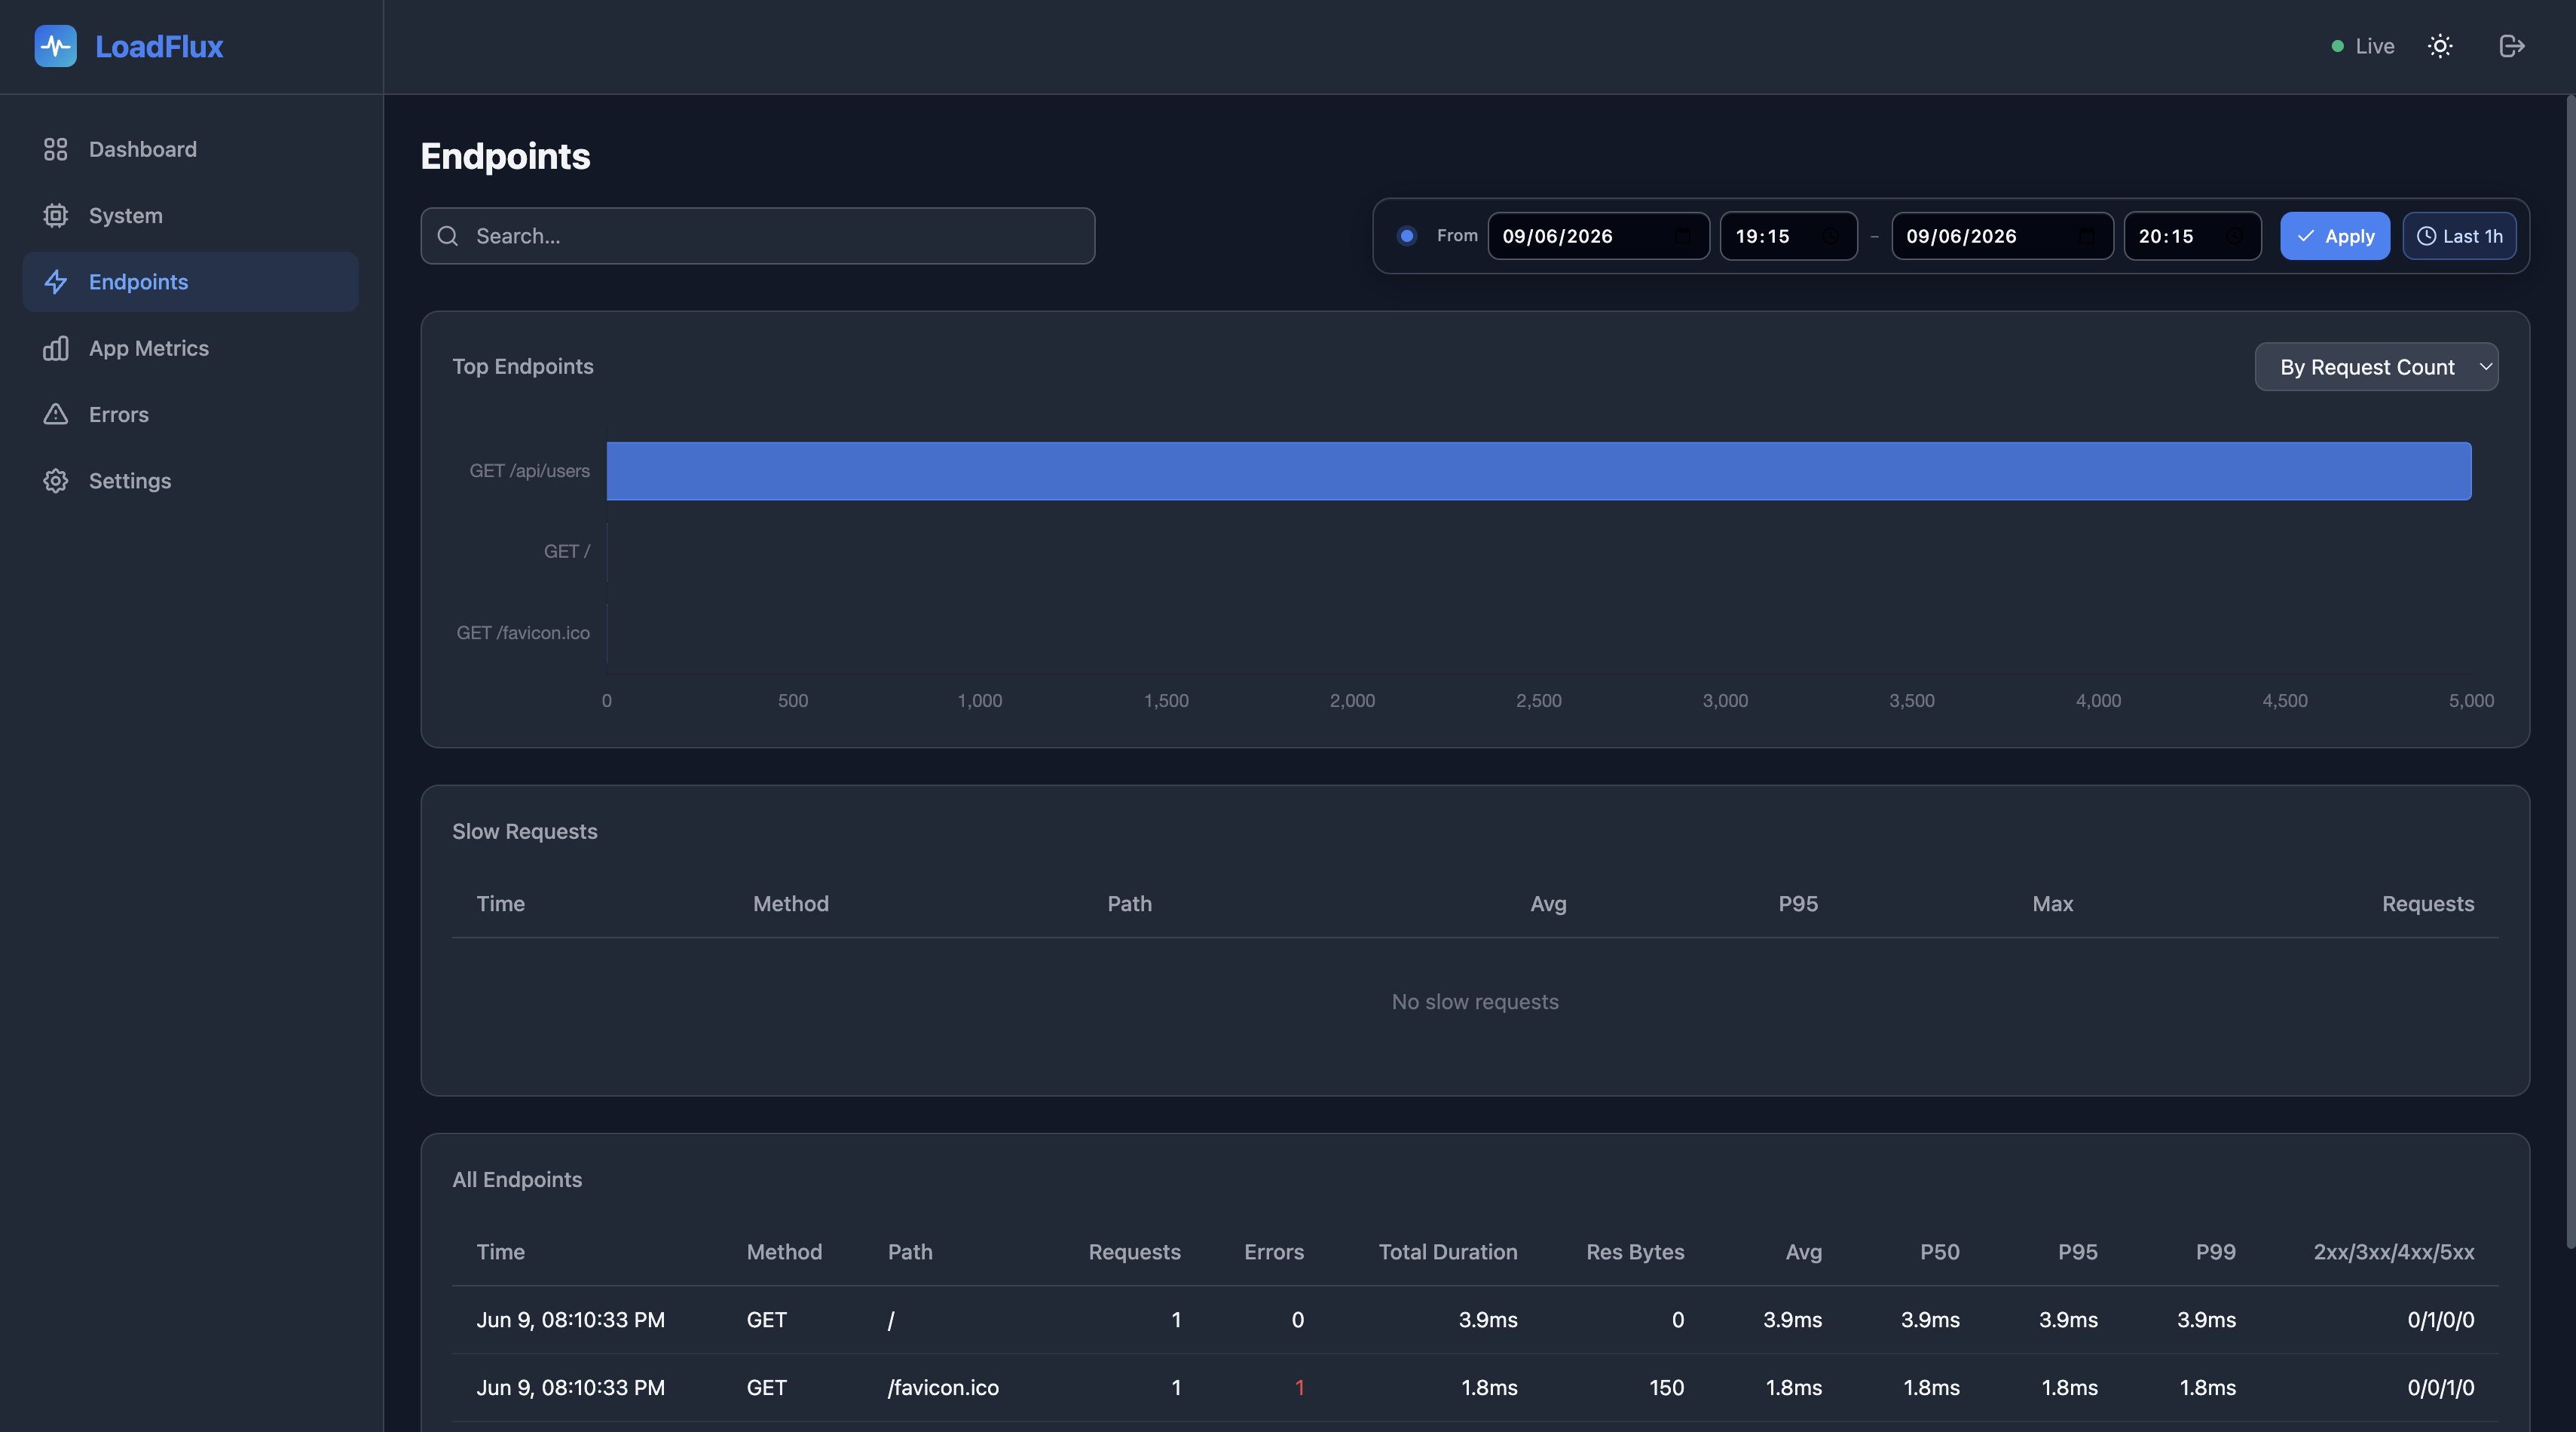
Detailed API endpoint analytics:
- Top endpoints by requests — Most-hit routes
- Top endpoints by latency — Slowest routes (by average duration)
- Slow requests — Requests exceeding the slow threshold (default 500ms)
- Endpoint metrics table — Full breakdown with request count, error count, and latency percentiles
- Search — Filter top endpoints, the metrics table, and slow requests by path or method (debounced; server-side
searchquery)
App Metrics
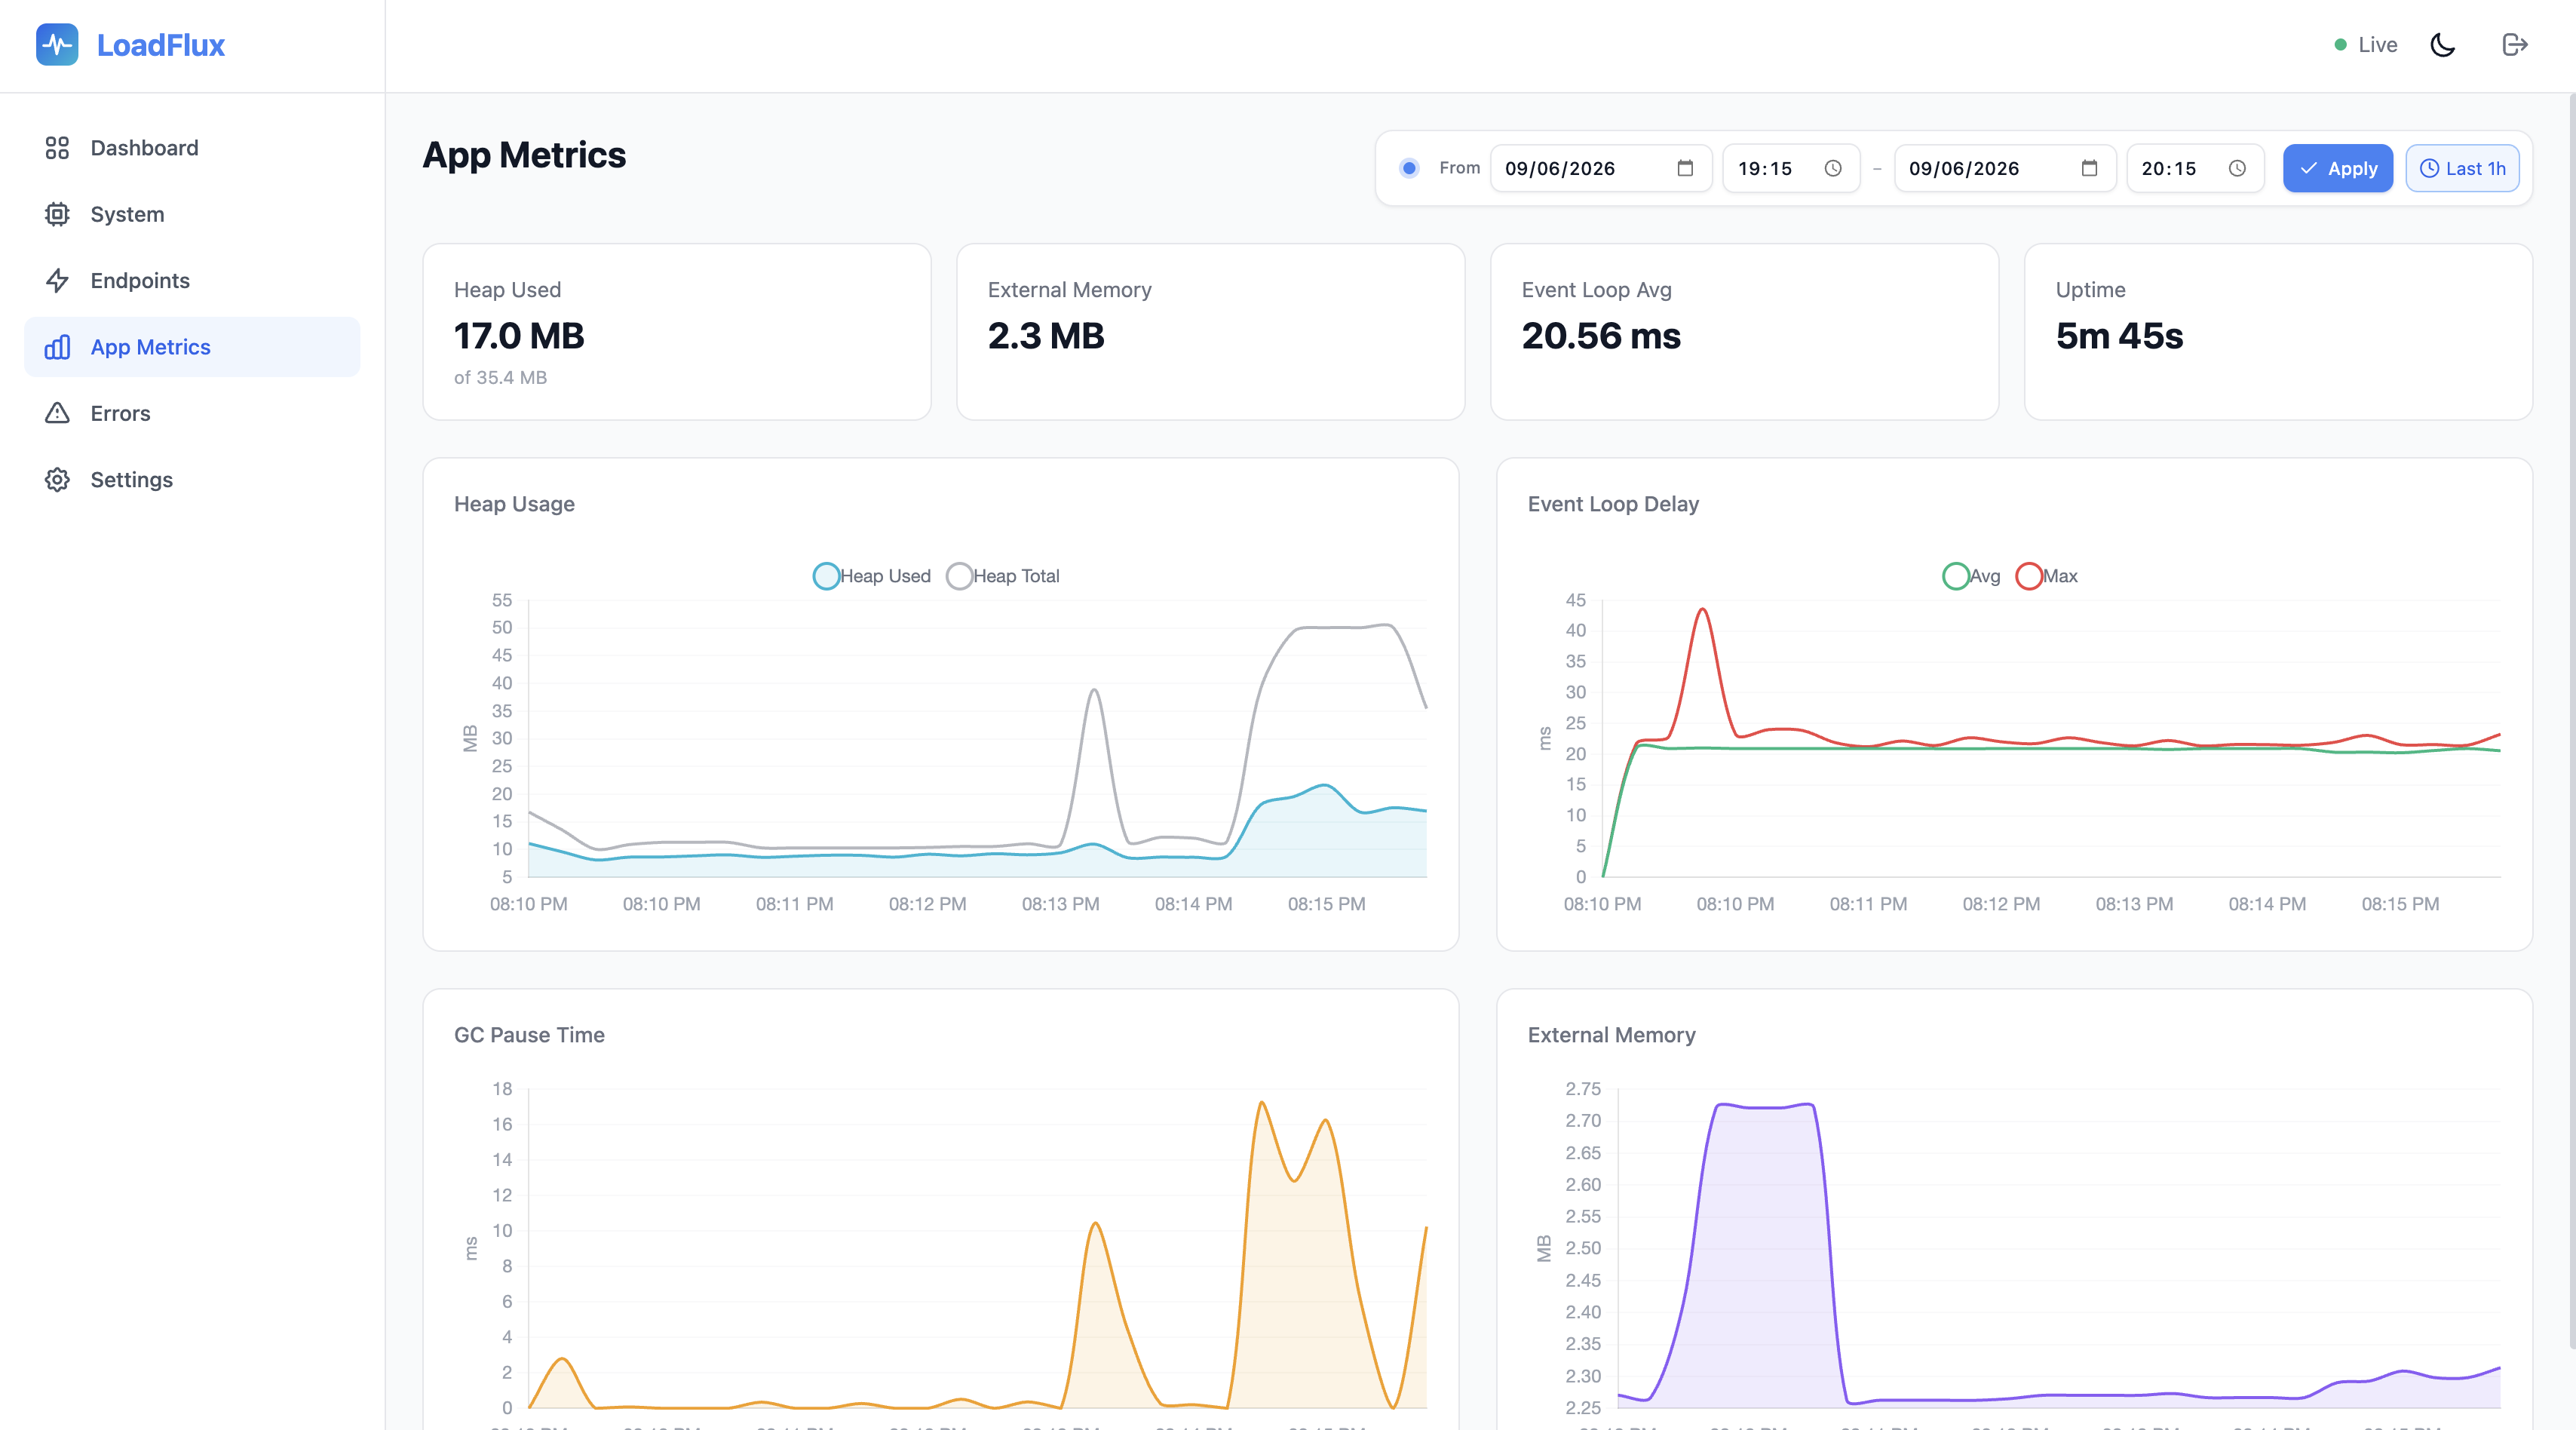
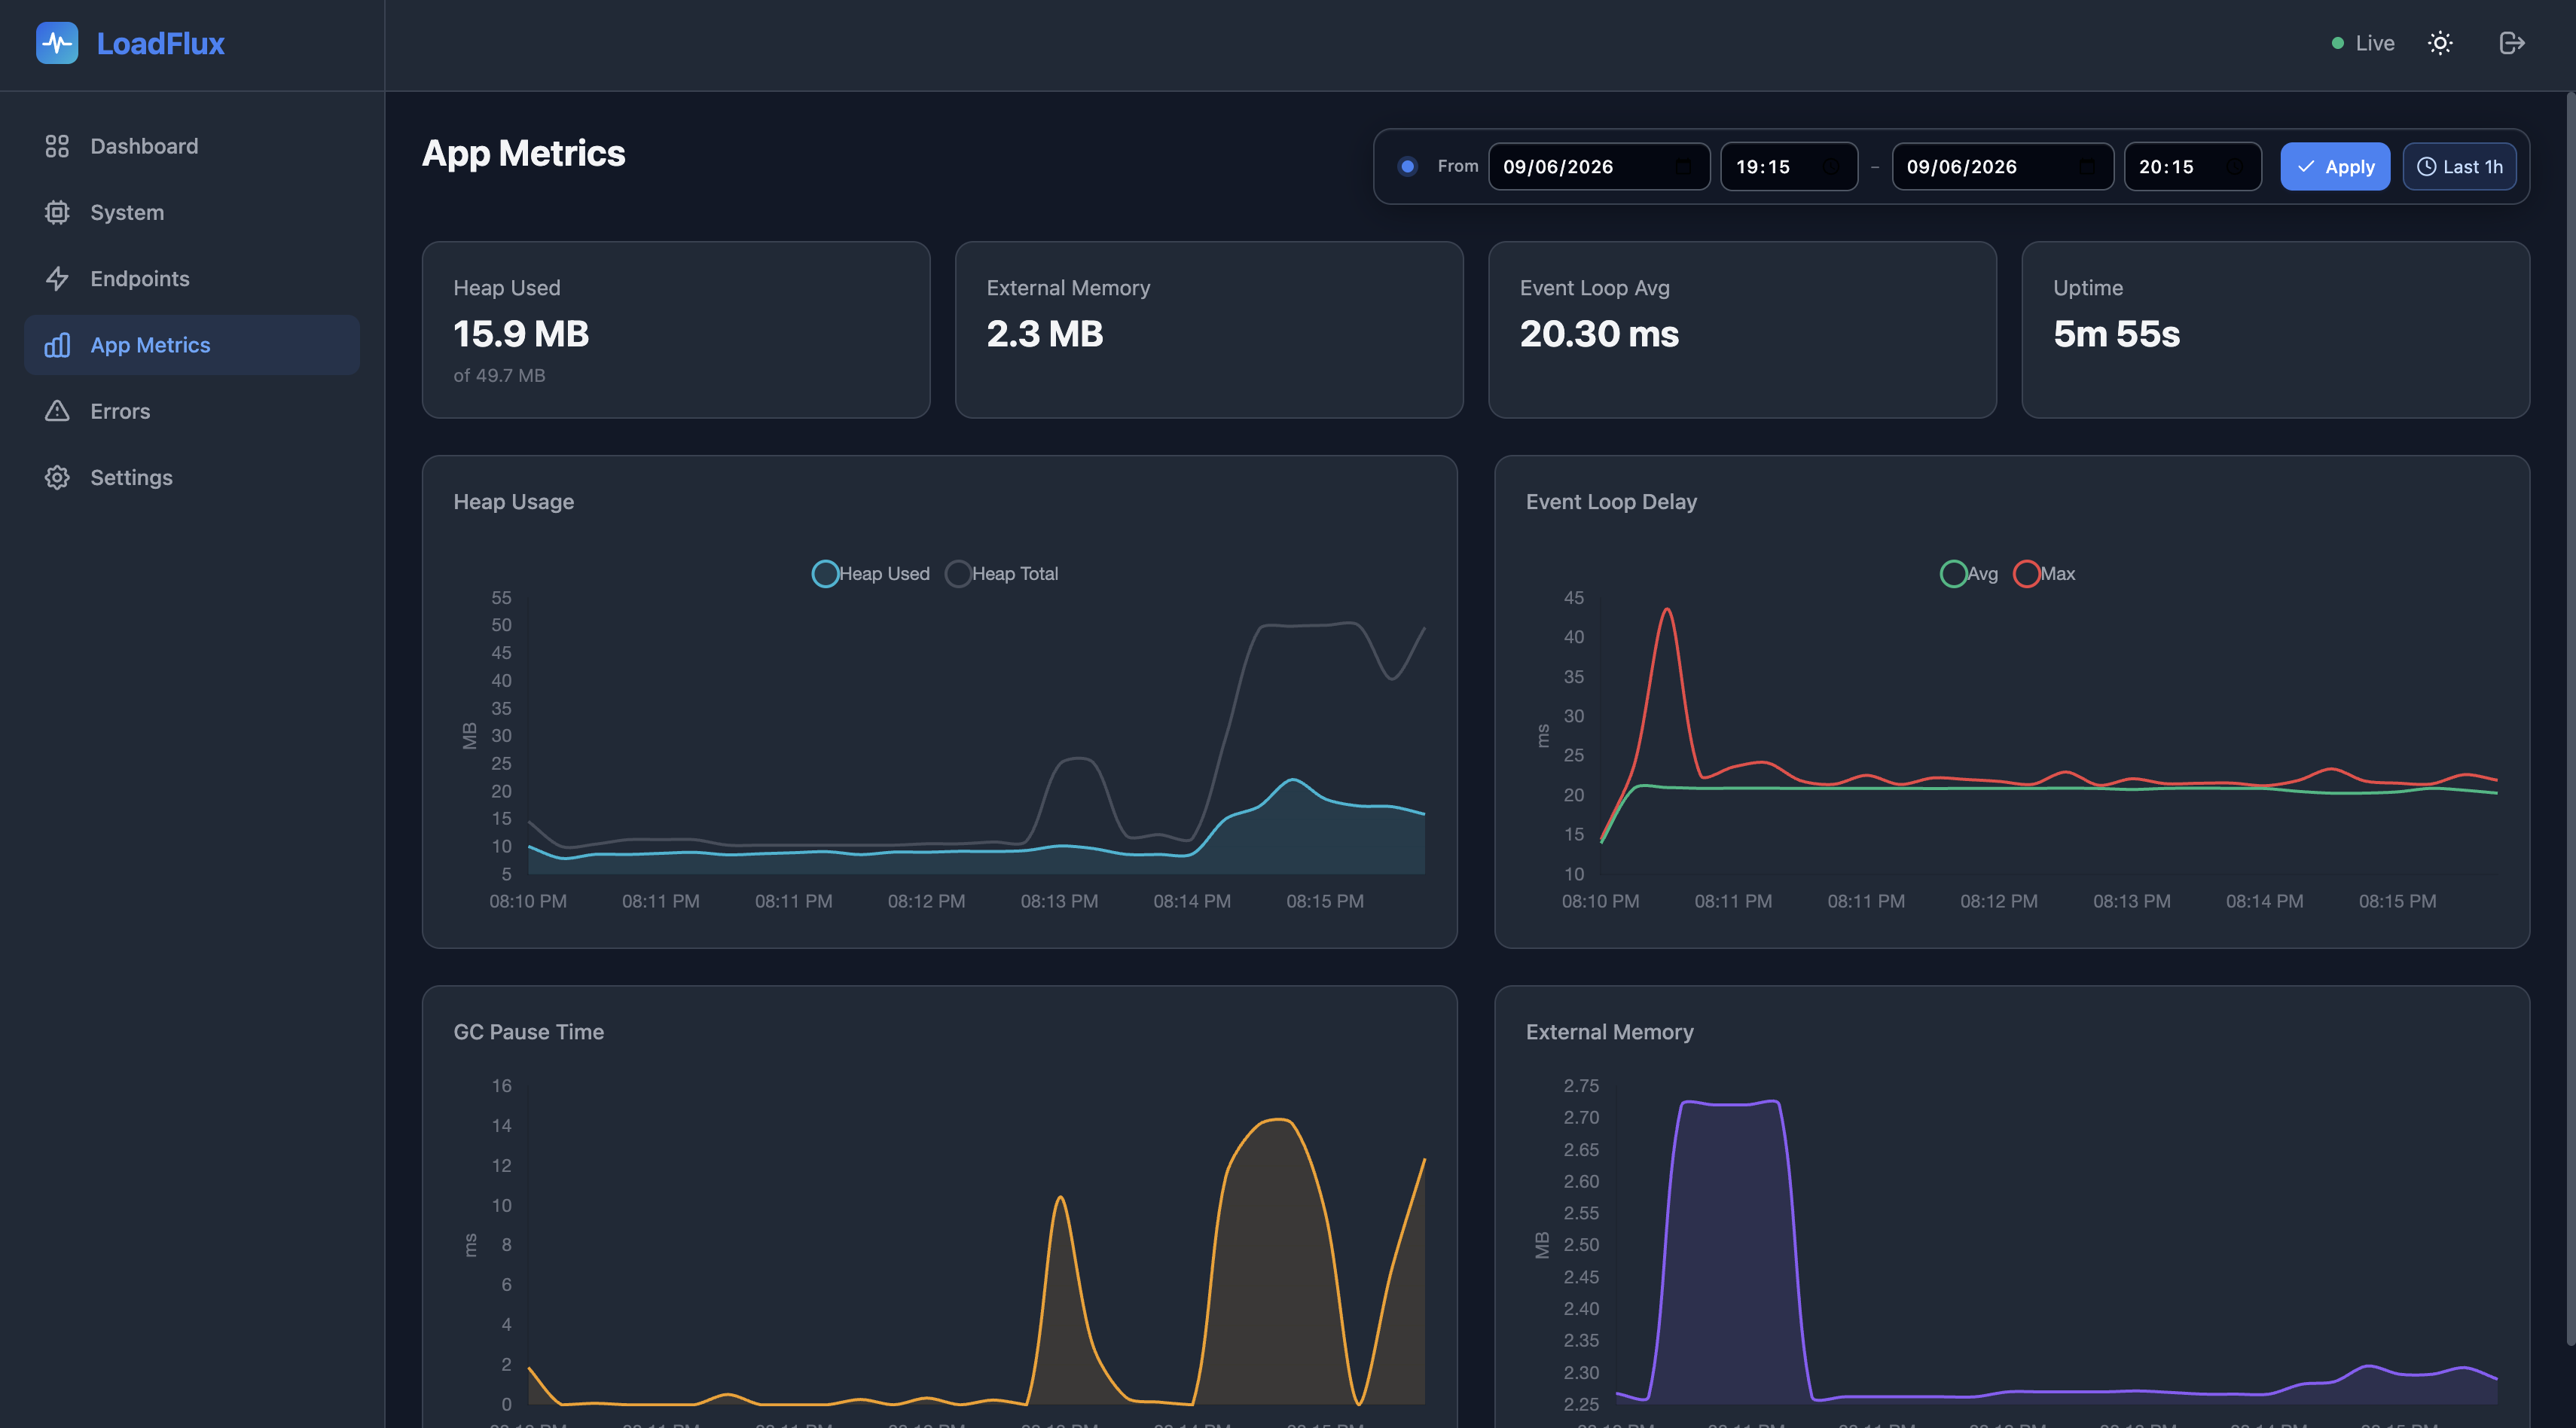
Node.js process health:
- Heap usage — V8 heap used vs allocated
- Event loop delay — Average and max delay in milliseconds
- GC pauses — Garbage collection pause duration
- Uptime — How long the server has been running (real-time from SSE)
Errors
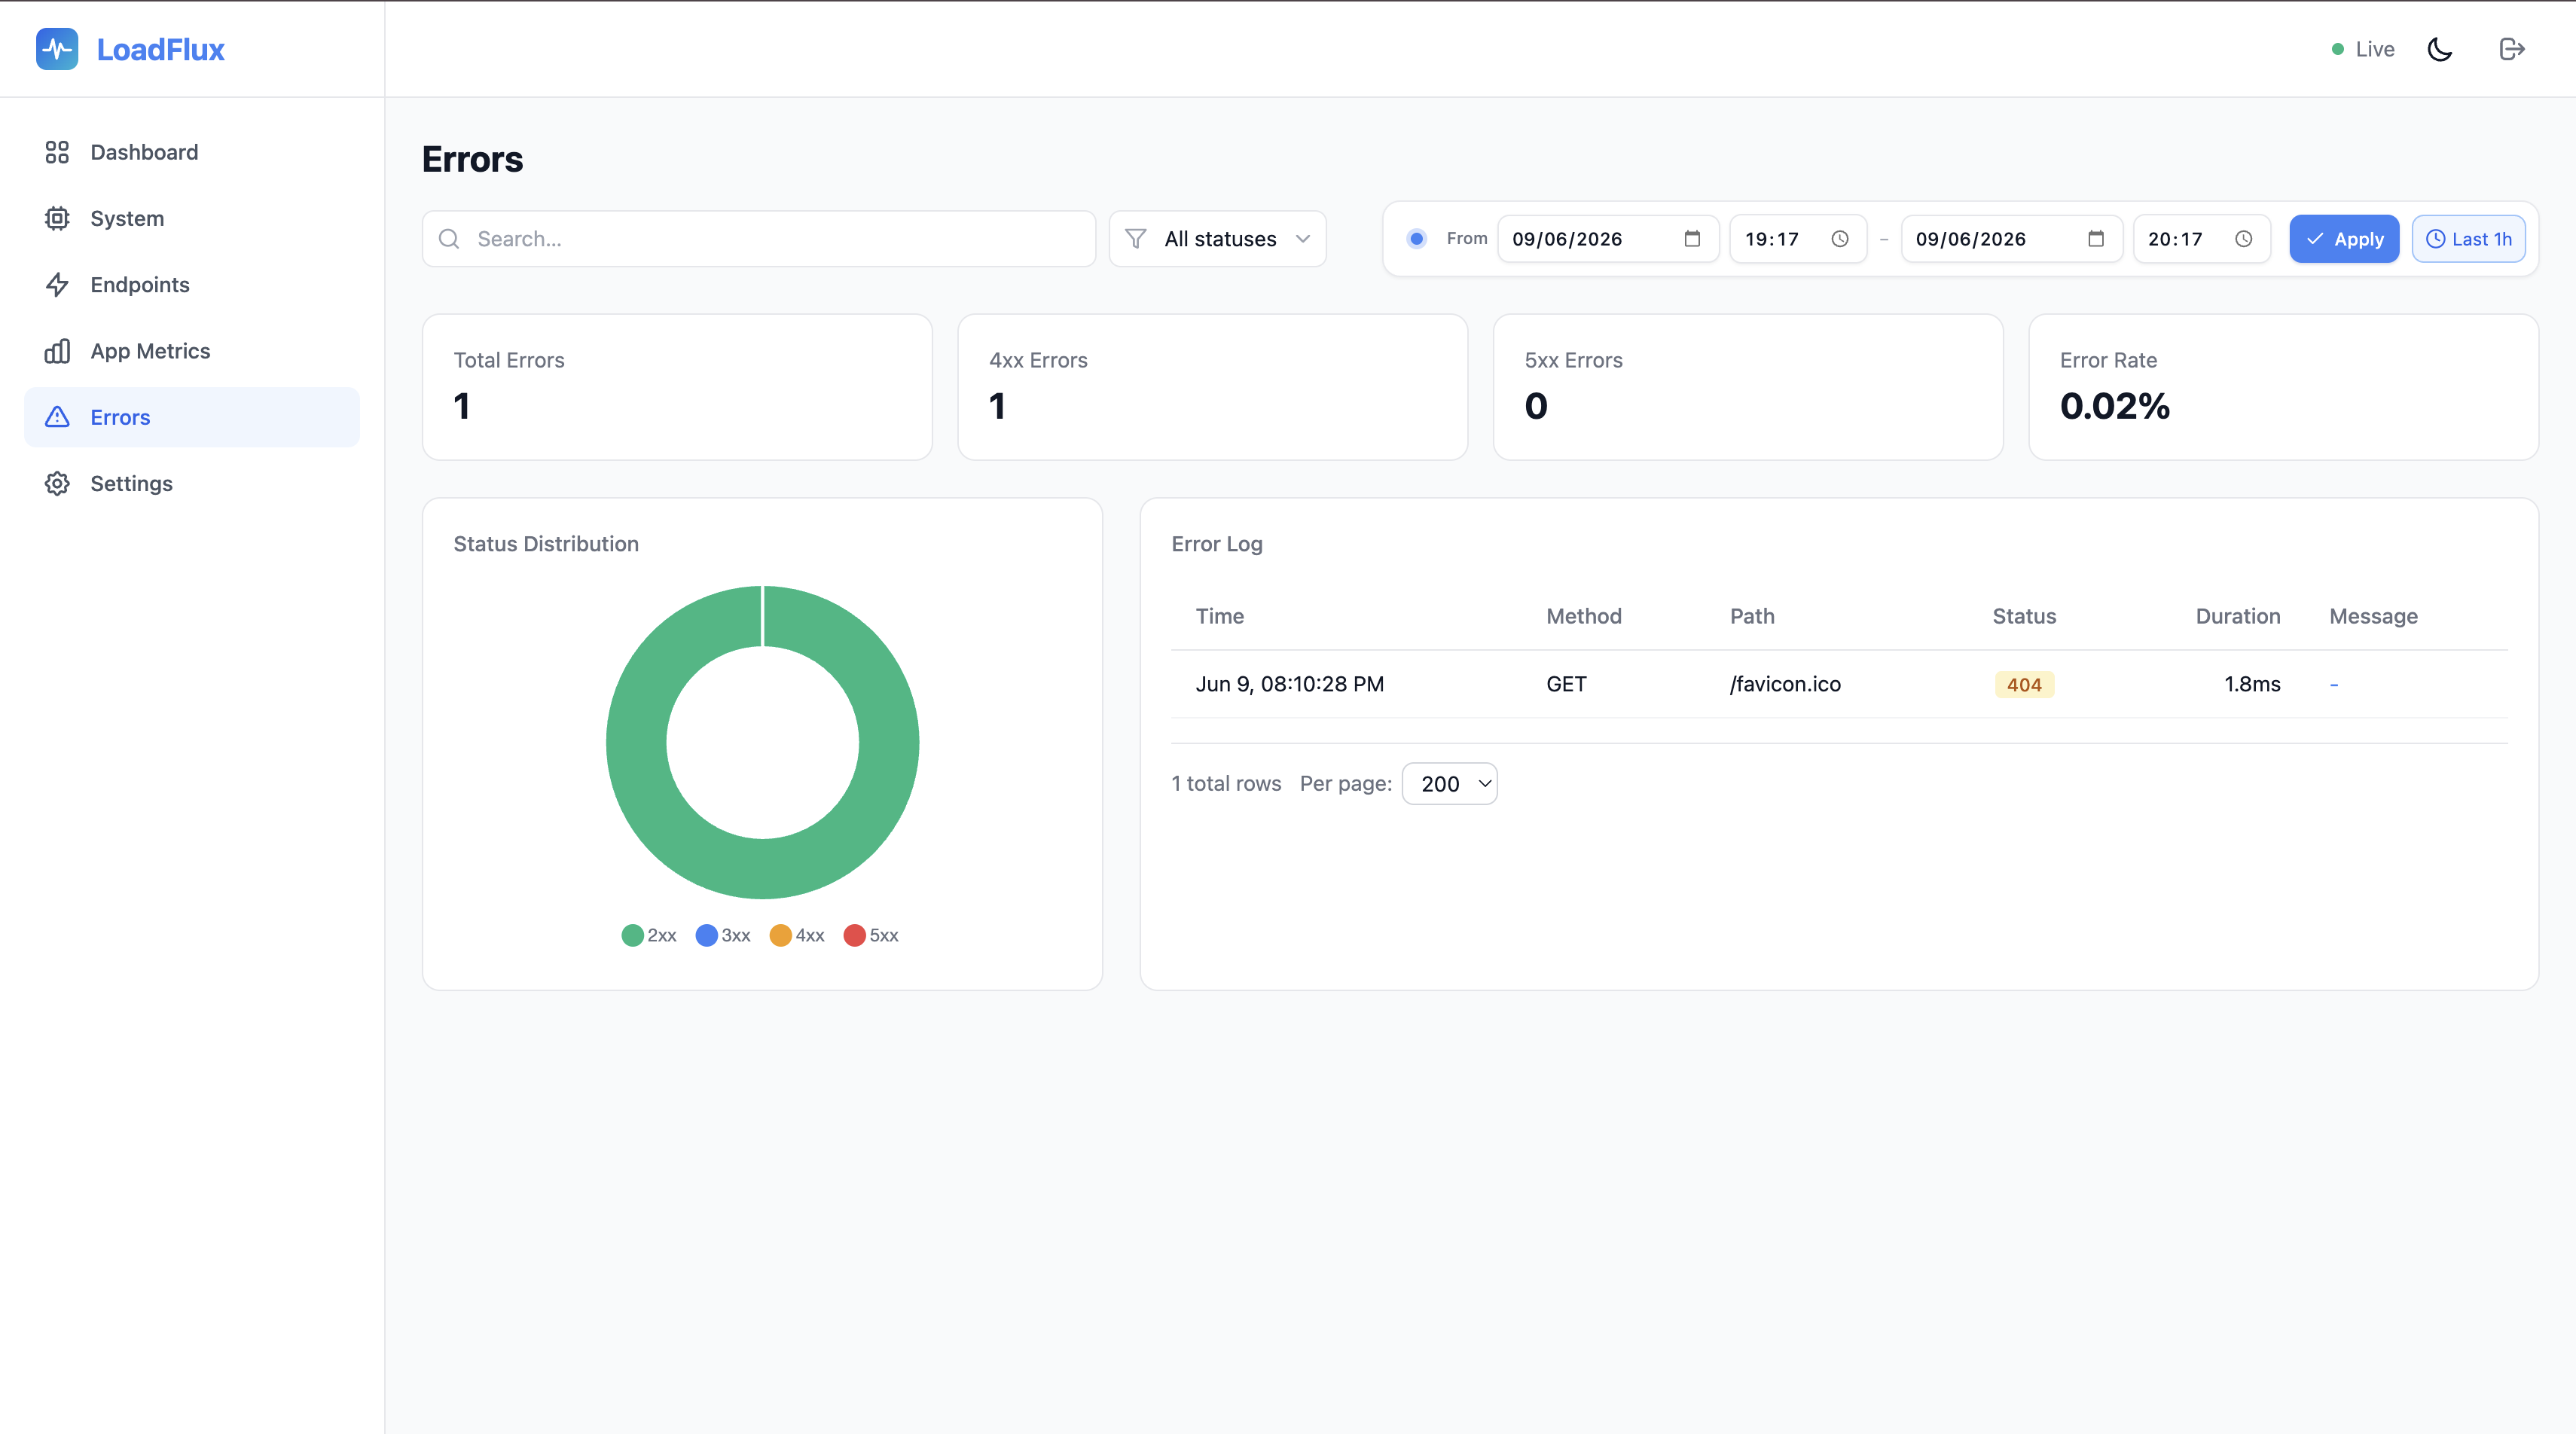
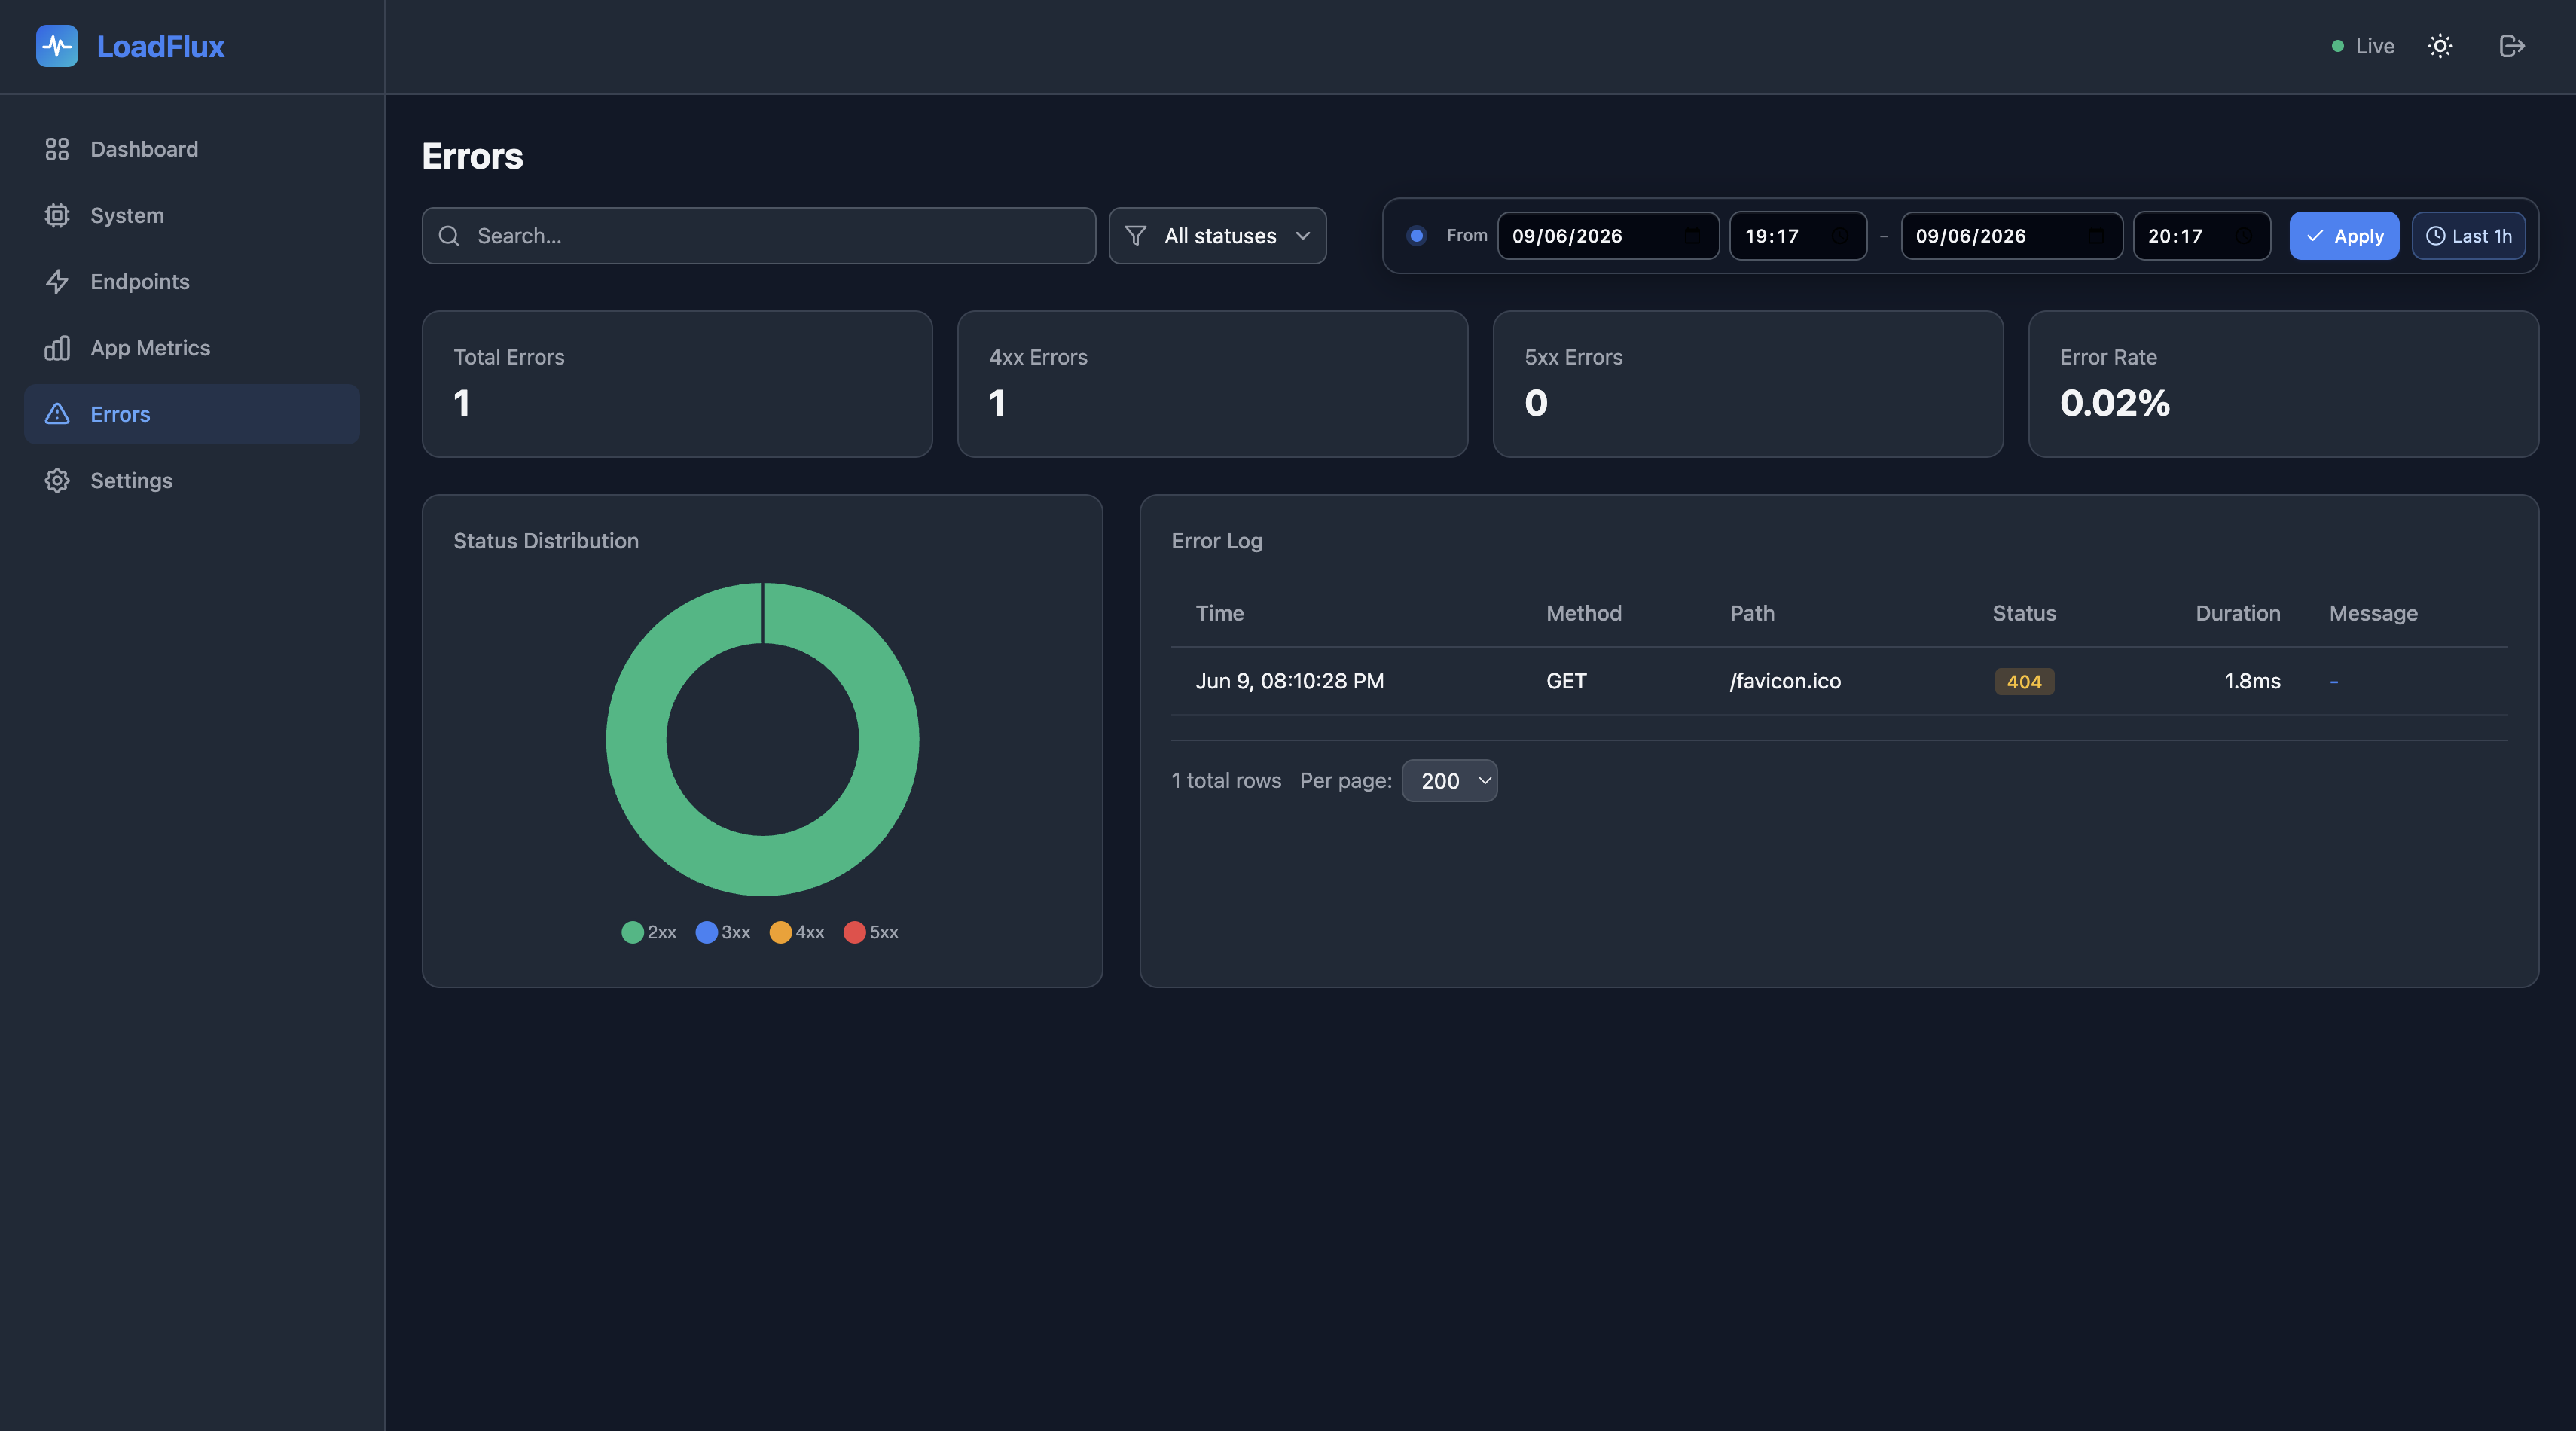
Error tracking and analysis:
- Status distribution — Doughnut chart of 2xx/3xx/4xx/5xx responses
- Error log — Table of individual error responses with timestamp, method, path, status code, error message, and duration
- Search — Filter the log by path, method, message, or related text (debounced)
- Status filter — Restrict the log to a specific HTTP status code seen in the current range
Settings
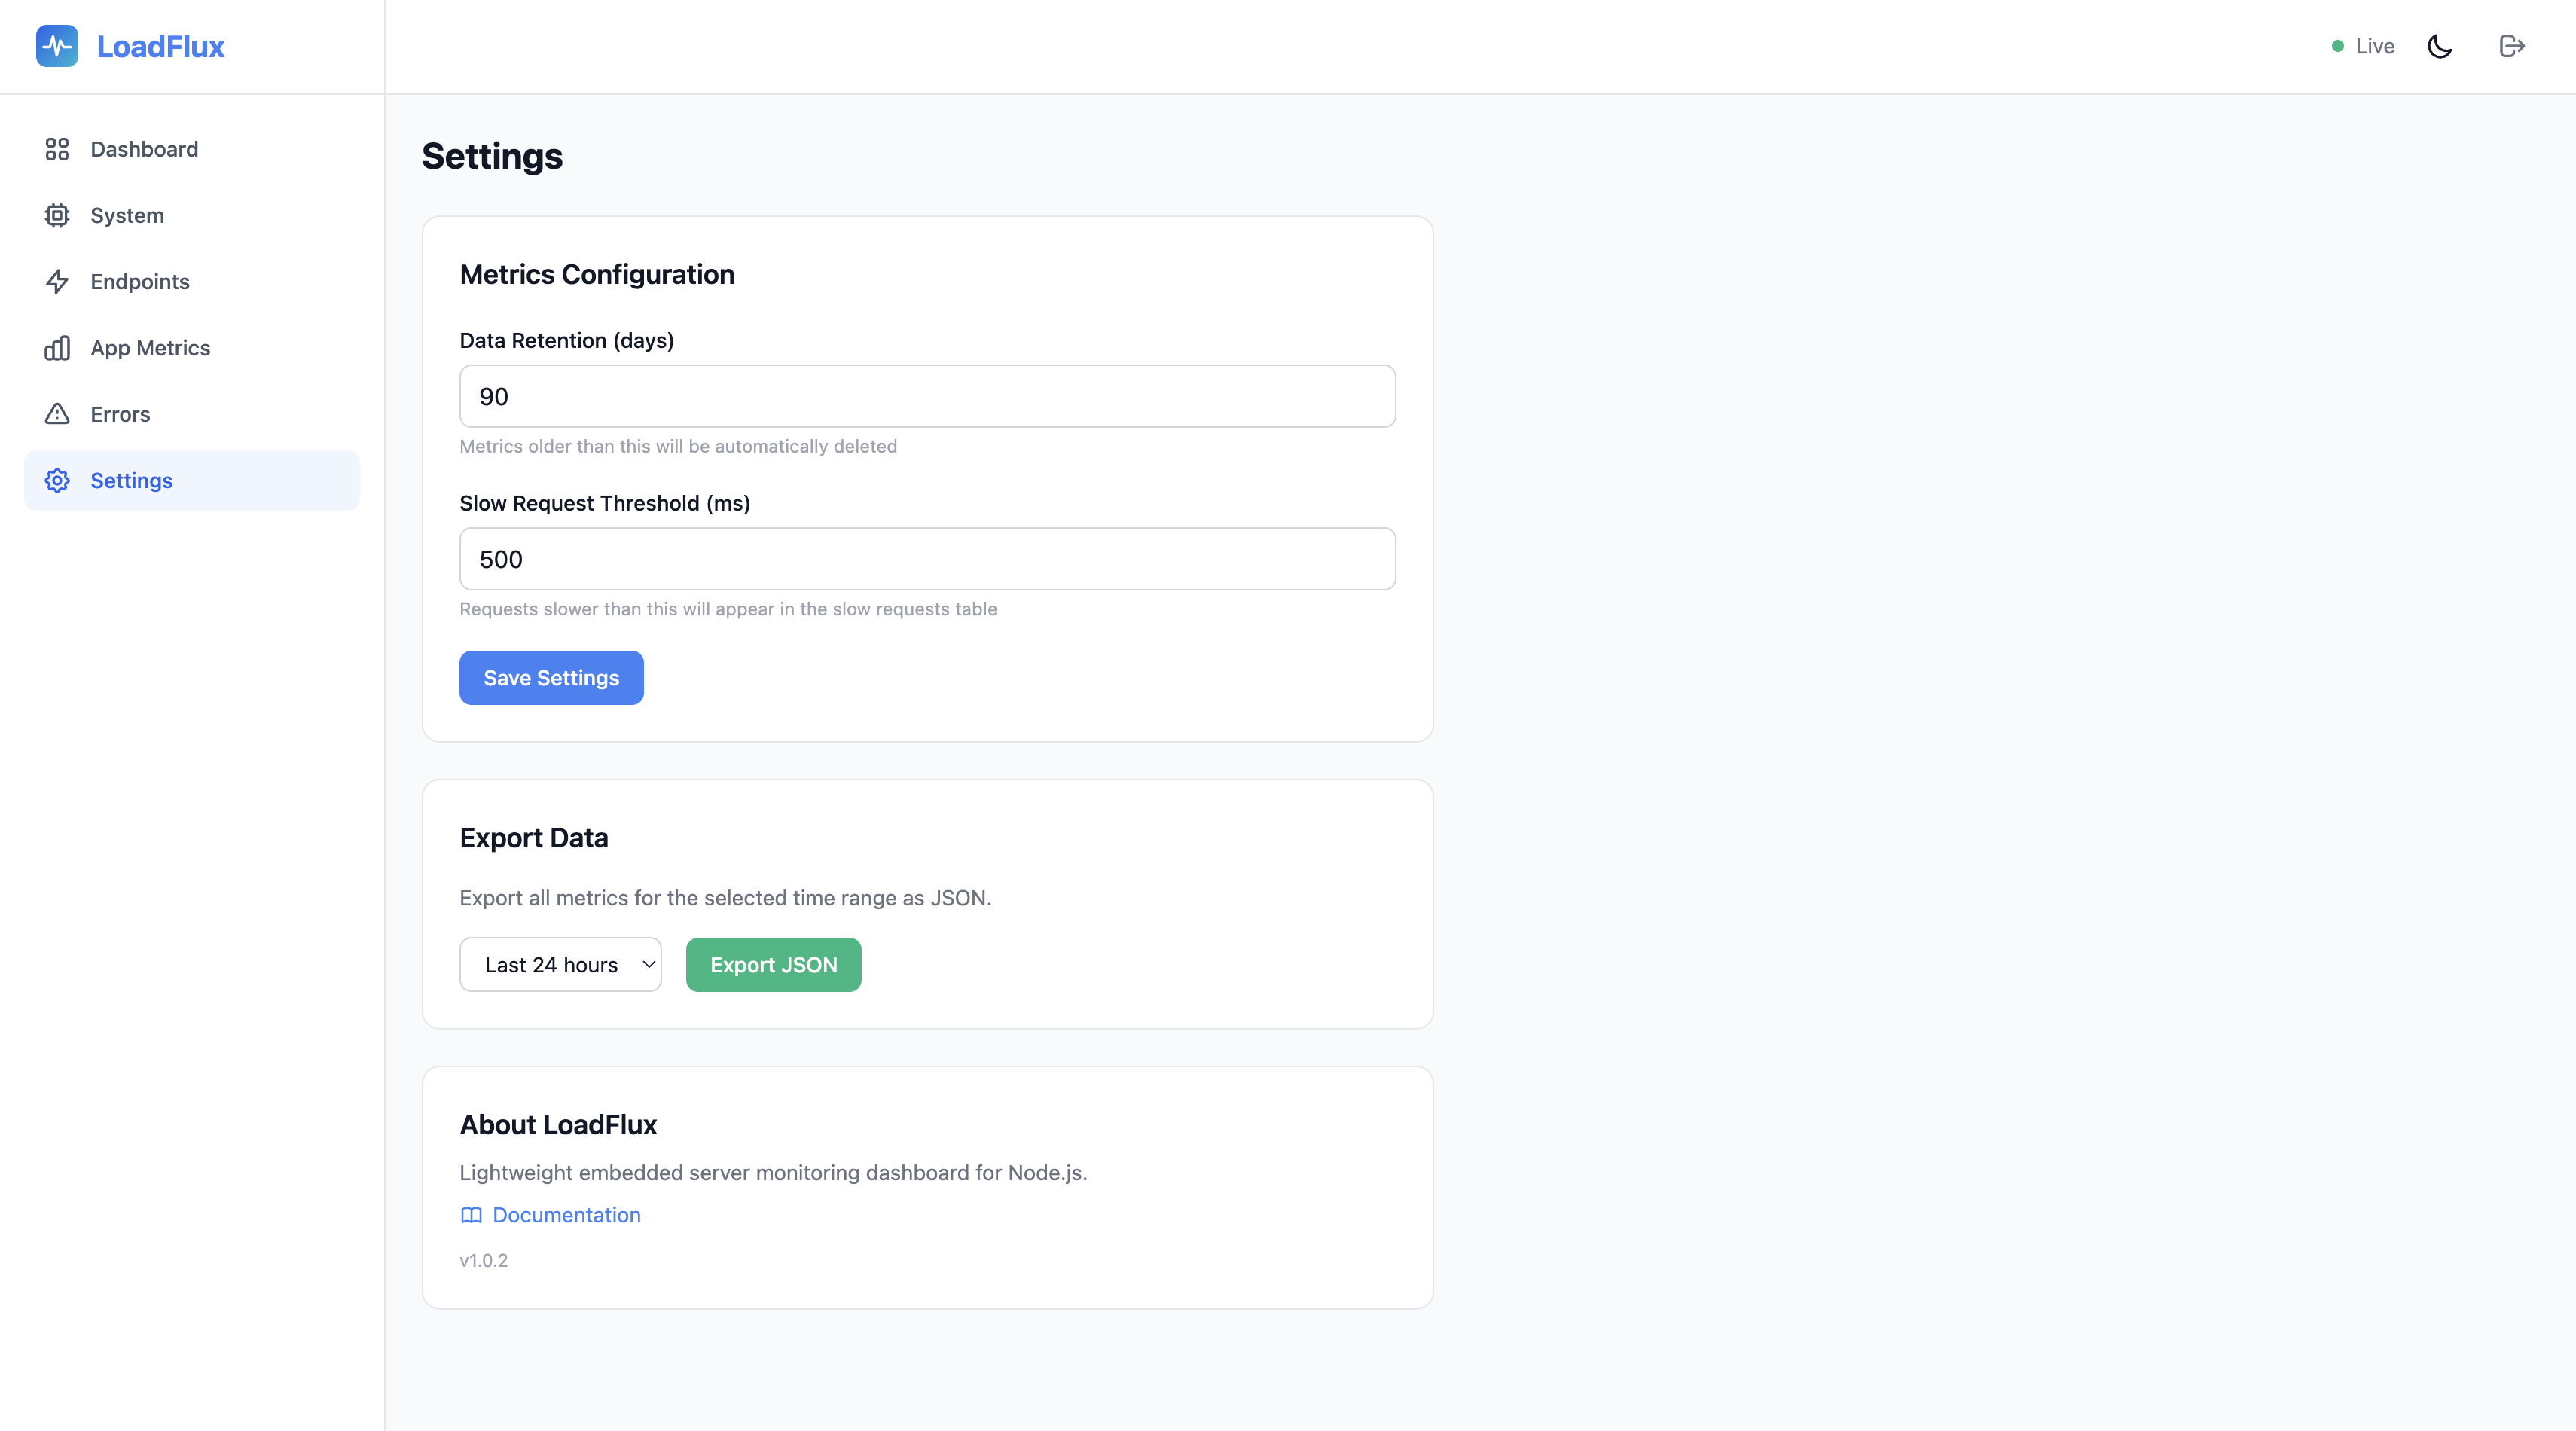
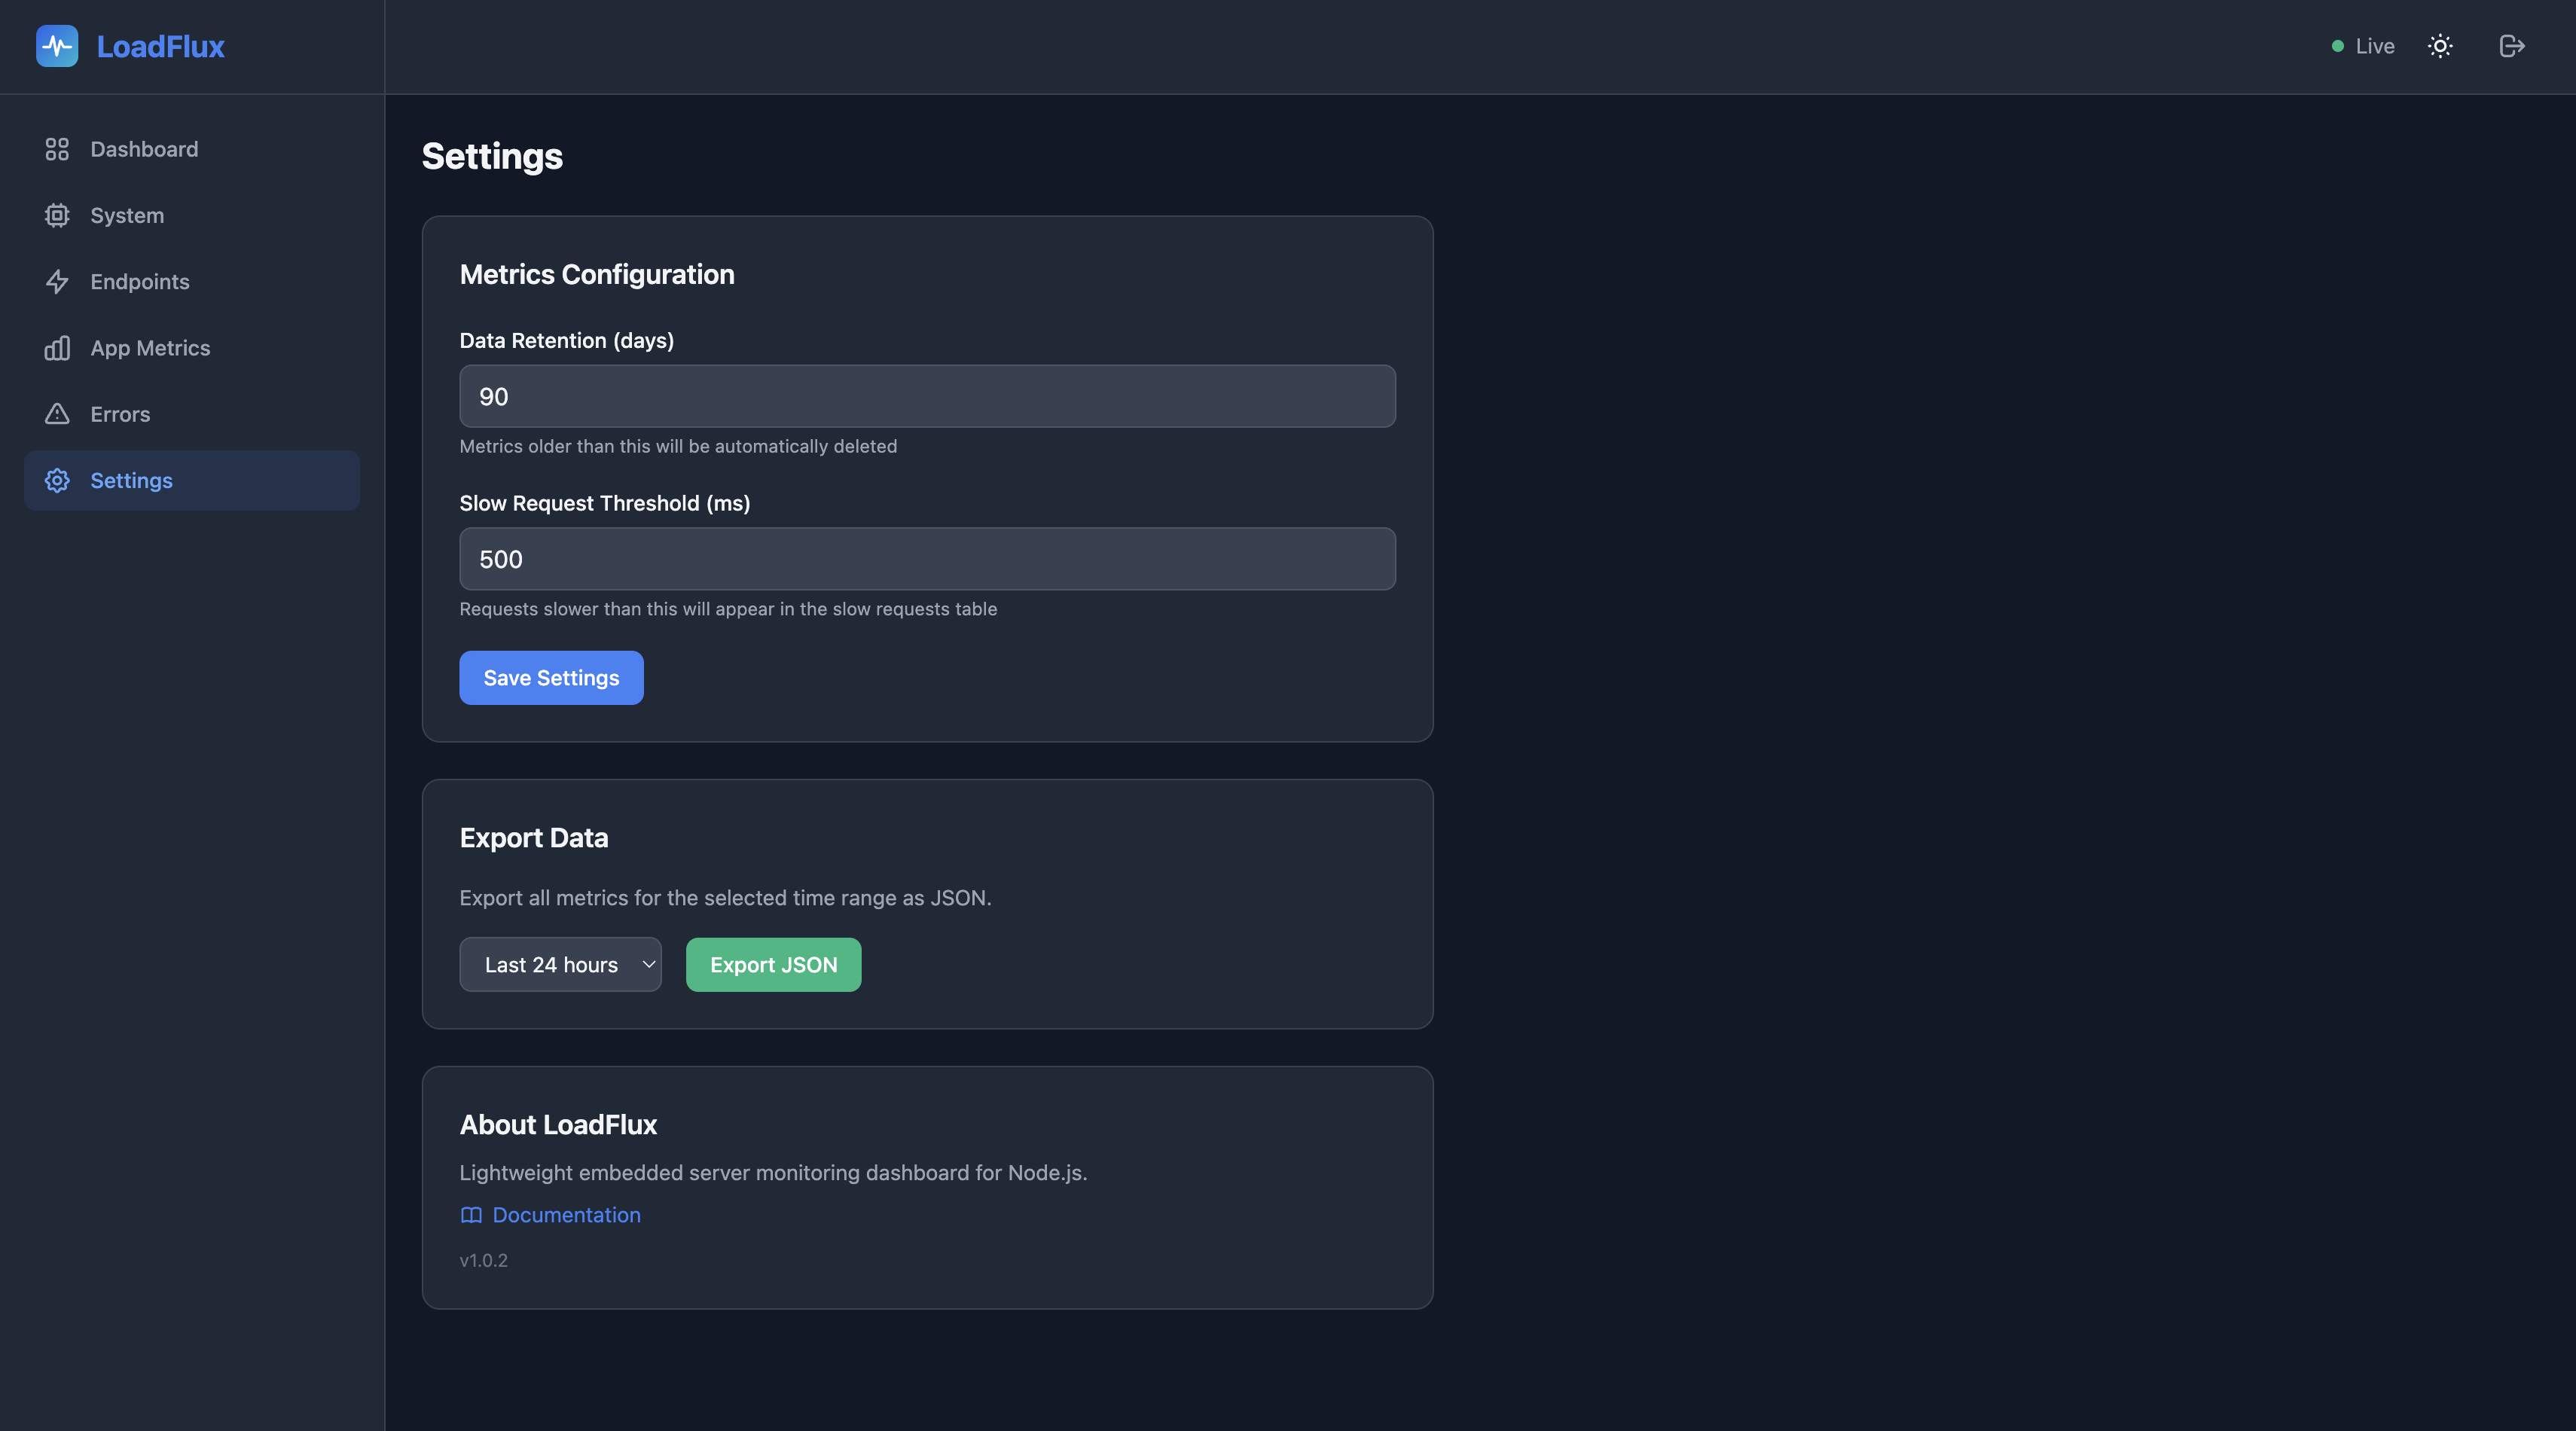
Dashboard configuration:
- Retention — View and change how many days of data to keep
- Slow threshold — Adjust the millisecond threshold for slow requests
- Export — Download metrics data as JSON for a selected time range (1 hour to the configured retention period)
Theme
Toggle between dark and light mode using the theme switch in the navbar. The dashboard respects your system preference by default.
Time range (historical pages)
System, Endpoints, App metrics, and Errors share the same control:
- From / To — Pick local date and time for the start and end of the window, then click Apply. The end must be after the start.
- Last 1h — Clears the custom window and uses a rolling last hour (
now - 1h…now), refreshed on each poll.
The home dashboard continues to use the live SSE snapshot (not this range).